Last Saturday at around 5pm I was frantically cleaning my house. I had cleaned the bathrooms, vacuumed, swept and dusted, and was about to wash the kitchen floor when it suddenly hit me. I was wasting my time.
Sensing an opportunity, I wisely settled into my favourite comfy chair, put my feet up and took a nap. This was a much better use of my time than washing the kitchen floor, especially considering the night ahead. Here’s why.
At roughly 8pm that night, the first of 50 or so of my friends would begin knocking on my front door to attend my annual spring party. I knew that many of the 50 would gather in the kitchen. All those feet would be guaranteed to make for a dirty floor, which I would have to wash again after the party.
The additional benefit of washing that floor before the party would be negligible, at best. I’d feel good about my clean floor (which no one else would notice), but only until all those feet arrived (with friends attached) and began to mess it up. On the other hand, a nap would really boost my energy for the evening.
Excessive investments of time and energy into house cleaning prior to a party are adversely affected by the law of diminishing marginal returns. (Try quoting me if you need to get out of a cleaning chore sometime!) For each extra cleaning investment, you get less and less back in terms of the quality of the party or the guests’ enjoyment of it. While a house needs to be clean enough to be presentable, it doesn’t need to pass the white glove test.
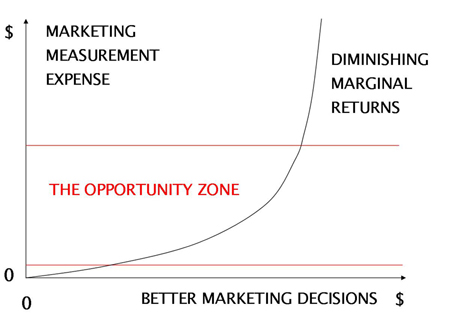
Similarly, investments of time, money and people into marketing measurement are also impacted by diminishing marginal returns. You shouldn’t overspend on measurement and it doesn’t need to be perfect or pass the measurement equivalent of a white glove test. It just needs to be good enough to help you to make better decisions. Consider the following visual:

The vertical axis represents the resources you invest (money, time, people) to measure your marketing. The horizontal axis represents what you learn from those measurement investments that help you to make better marketing decisions, thus improving your marketing effectiveness.
The curve represents my view of the rate at which incremental measurement investments improve marketing decision quality. Generally, the more you invest in measurement, the better your marketing decisions get, but it’s not a straight linear relationship.
Let’s look at this curve in each of the three zones separated by the two red horizontal lines, starting from the bottom zone.
Bottom Zone
- Characteristics: Starting at zero on both axes, as you begin to measure you very quickly learn things that can improve marketing decisions. Most organizations in this zone have very small marketing budgets, and few resources, so it may not be possible to invest much in measurement, nor are there many marketing decisions to improve.
- Recommended Strategy: Take advantage of no or low cost measurement tools and internal data. Measure anything and you will likely learn something useful.
Middle Zone
- Characteristics: Organizations in this “Opportunity Zone” have marketing budgets that are big enough to be worth measuring, and can allocate a small percentage of their budget to measurement. The opportunity in this zone is that small investments pay off quite nicely in the way of improved marketing decisions. The return from better decisions shows up as lower or more efficient marketing expense, and higher revenue and profit.
- Recommended Strategy: Consistently apply a disciplined and practical approach to learn what you need to know to improve decisions. Resist the temptation to over invest in the more sophisticated (and expensive) measurement solutions that will bring you closer to the steepening section of the curve where you get a lower return for your incremental investments.
Top Zone
- Characteristics: Here we see the most severely diminished marginal returns from measurement investments. It takes significant additional investments to yield even the slightest improvements in decisions. Only the largest of organizations with enormous marketing budgets can play successfully in this zone, as small market share gains and sales lifts can be very profitable. Other characteristics of this zone will include a lot of complex data and sophisticated measurement techniques.
- Recommended Strategy: Question every bit of measurement spending. Just as there is great opportunity to learn at the lower end of the curve, on the upper end there is equally great opportunity to reduce measurement costs without significantly damaging decision quality.
That’s the way I see the relationship between measuring your marketing and how it helps you to get better results. There are exceptions to every rule, but the law of diminishing marginal returns is one of economics’ most powerful laws, so ignore it at your peril.
Have you identified which zone of the curve you’re in? There are a lot of organizations in the bottom and middle zones, who may not currently measure their marketing, or who aren’t happy with their efforts to do so. If that sounds like your organization, a great opportunity knocks at your door!
In the meantime, if you need me, I’ll be in the kitchen mopping the floor!


Speak Your Mind