Where the Rubber Hits the Road

Indy Car
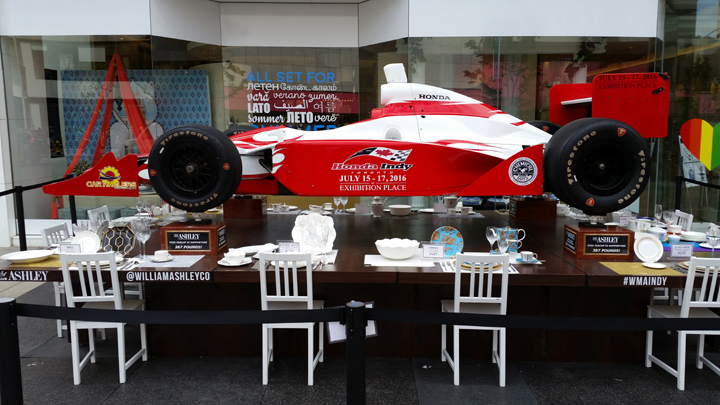
While walking east along the south side of Bloor Street in mid-town Toronto with my colleague Bob, I saw something quite unusual. Hovering above a large wooden table on the sidewalk in front of William Ashley’s store at 55 Bloor Street West was a full sized Indy race car. I don’t know a lot about racing, but I do know that cars and their tires are supposed to be on the road, so I was intrigued.

On closer inspection, I discovered the 1,400 pound replica car wasn’t hovering but was sitting on four delicate looking bone china tea cups, one under each tire. The tea cups themselves were part of an elegant table setting featuring William Ashley’s finest.

A little online snooping uncovered that William Ashley launched the display in 2011, 25 days before the 25th anniversary of the Honda Indy race in Toronto. The race organizers had approached William Ashley, a long-time sponsor of Toronto’s annual Indy race, with this outdoor display idea to jointly promote the race and the store, along with the superior strength, durability and performance of bone china.

As we discussed the uniqueness of this marketing idea, Bob turned to me and asked the question I get asked the most. “So, how would you measure that marketing program?”

Without flinching, I replied with my favourite answer, “It depends”. Since I didn’t know William Ashley’s actual planned objectives for creating this display, I couldn’t know exactly how to measure whether or not it worked.

Despite that roadblock, we agreed to speculate on what their objectives might generally have been, and I’ve added some measurement thoughts for each:

  • Objective #1: Create a unique and interesting event to generate press coverage.
  • Measurement #1: In its simplest form, this is a matter of tracking the number of impressions through the various stories and mentions about their launch event through various print, broadcast, digital and social media.
  • Objective #2: Communicate the key attributes of bone china.
  • Measurement #2: While the first objective relates to how much coverage, this one relates to more important issues, such as the quality, accuracy and tone of the coverage. It could get into things like media monitoring, text analytics and sentiment analysis of the various forms of coverage. You could supplement that with before and after surveys and by intercepting people on the street to see if they saw the display and understood the message.
  • Objective #3: Increase store traffic.
  • Measurement #3: Count the customers, of course, but you need to compare the count to something, like how many customers they normally get on Wednesdays in June, or when they’ve created similar displays previously.
  • Objective #4: Increase bone china sales.
  • Measurement #4: It’s easy enough to add up the sales, but it would be helpful to compare the total to an average, or baseline, as with the store traffic example. You’d also have to decide how long that display might affect bone china sales. Seeing that display made me think (and write) about the superior strength, durability and performance of William Ashley’s bone china, and maybe now you’re starting to think about it. I’m not in the market for bone china right now, but maybe in the future and perhaps you will be too!

The key lesson in all of this is that you need to set clear measurable objectives when planning your marketing in order to know what to measure and learn whether you’ve succeeded. In other words, measurement should be directly linked to your planning process. Defining how you will assess whether a marketing program is successful should be an integral part of planning.

Good objectives will define the metric(s) that will be used to measure success, and the specific numerical outcome you want to achieve. For example, it can be a percentage change from a comparable period, or a specific outcome that you’ve determined would be worthwhile relative to the cost of the program.

My four speculated objectives above were purposely vague to highlight the challenges presented by the lack of clarity.  When you set your objectives, be very clear about the outcome you’re looking for. Here’s a better version of Objective #4: “Increase bone china (all brands) sales for June and July by 20% vs. June and July of last year”. That, you can measure.

Without proper objectives, how or what to measure becomes an exercise in guessing, much like Bob and I had to do. To take the guesswork out of your marketing measurement, it needs to begin as part of your planning process. That’s where the rubber hits the road.


Big Data, Small Data


Introduction

Marketing measurement is a big problem, but the solution to the problem doesn’t also have to be big. In fact, it can be small.

This month’s post is about taking a small data approach to a big marketing problem.

_______________________________________________________________________________________


On Monday afternoon, I met my friend Reuben to get caught up over a coffee. I always enjoy our chats as they usually cover a wide range of interesting topics. Reuben also tends to ask great questions and make insightful comments. Monday was no exception.

While discussing how pervasive technology, analytics and big data are in marketing, we concluded that in contrast to all of that complexity and big data, I come at marketing measurement from a different angle; with something we might call a small data approach.

There is an emerging definition of small data as the few key pieces of meaningful, actionable information that we can uncover by analyzing big data. Those insights you extract from your big data become the last steps along the way to making better marketing decisions.

Actually, neither one of us had that definition of small data in mind during our discussion. Rather, we spoke of my “small data” approach to marketing measurement as small relative to other approaches and to the complexity of the problem.

My approach does align with the above definition of small data in the sense that I am very focused on organizing the chaos of all that data, uncovering insights and helping marketers to learn what they need to know so they can make better decisions. That is the reason to measure marketing and it needs to be the focus of any approach to measuring marketing.

Where my scorecard-based approach might also seem a bit contrarian is in its emphasis on measuring results vs. objectives and in not trying to calculate a financial return on investment (ROI). Although it would be ideal to accurately measure the financial ROI of marketing programs, as I have written about in the past, I think there are too many problems with doing financial ROI calculations for individual marketing programs.

I’ve always thought of my approach as a practical approach to a complex problem. As of Monday afternoon, I’m also starting to think about it as a small data approach to a big data problem. To explain what I mean by a small data approach, let me start with some thoughts on big data.

Big Data

Big data flows out of a set of circumstances that will tend to occur at bigger companies, and might include some combination of the following:

  • Big marketing budgets
  • Many marketing programs
  • Many products and/or services
  • Many communications channels
  • Many and diverse customers and customer segments
  • Many touch points on the customer path-to-purchase
  • Many transactions

These circumstances lead to a whole lot of data to analyze and understand which in turn leads to big data measurement solutions that will also tend to be big, complex, sophisticated and expensive.

With all the buzz around big data, it is easy for small and mid-sized companies to conclude that a high-science, big data solution must be the only legitimate way to approach marketing measurement. For many of these companies, a big, costly sophisticated approach isn’t needed or practical under their circumstances. A smaller, more practical approach can do the trick.

Small Data

Most small to mid-sized companies don’t operate under the same set of circumstances. Their budgets aren’t as big, their marketing activity is much less involved, their world is much less complex and they generate and collect a smaller amount of data. They also have fewer resources with which to take on the problem that all marketers must solve, which is to determine the best ways to invest their budgets.

A small data approach can be a great fit under these smaller circumstances. Yet, given the range of company size and marketing activity within the small to medium sized businesses segment, a one-size-fits-all approach doesn’t work. Any approach needs to have some built in flexibility so you can scale up or down to be appropriate for the size of the marketing budget being measured.

That’s really where I stand on marketing measurement. Right size your approach to your circumstances, and don’t overspend on measurement by bringing an over-sized solution to your problem.

Don’t over allocate resources to measuring something that you can’t measure perfectly, as the law of diminishing marginal returns will ensure you waste some of those precious resources. This is not about measuring perfectly; it’s about perfecting your marketing.

_______________________________________________________________________________________

About the Author: Rick Shea is President of Optiv8 Consulting, a marketing effectiveness consultancy with a focus on helping small to mid-sized organizations measure their marketing so they can stop wasting money.

Copyright ©2014 Optiv8 Consulting.  All rights reserved.

You may reproduce this article by including this copyright and, if reproducing electronically, including a link to:  http://www.optiv8.com/

Christmas Giving

I used to think that Christmas was all about the gifts, especially the receiving of gifts. As a kid, I remember the excitement of flipping through the Eaton’s and Sears catalogues and telling my parents which gifts I wanted Santa to bring me. My Christmas spirit was all about what was in it for me!

Of course, as I grew older my focus on gifts gradually shifted from receiving to the thrill of giving great gifts. Seeking out those great gifts became a big part of my getting into the Christmas spirit.

For a number of years, my siblings and I shared a fun tradition of going to our local mall on the afternoon of December 24th to pick up last minute gifts and stocking stuffers. Part of the fun was seeing who we’d bump into at the mall, like my high school gym teacher, Mr. Martin. I didn’t have the wisdom to ask him but I suspect he was there every year to see who he could bump into. Maybe that was one of his Christmas traditions and a way for him to get into the spirit.

With time, I’ve come to realize that much of my Christmas spirit comes from the traditions I’ve shared with my family. For example, we have many eating traditions; tourtière and French onion soup for Christmas Eve dinner, croissants on Christmas morning, the big turkey dinner, and of course a vast selection of desserts suitable for any meal or between meals!

A fun tradition emerged quite by accident one year when my mom gave each of us four kids a flexible, pliable little Santa Claus. We quickly realized we could entertain ourselves and each other by bending and twisting Santa into a new position, and then giving him a new name. I’m not quite sure how it started but it’s likely that my brother Jim had something to do with it. Here are a few favourites:

You get the idea. The possibilities are endless. This year, I have decided to print Christmas cards for my three nephews featuring these and other versions of Santa in the hopes it might inspire them to develop some silly traditions of their own.

I still enjoy giving gifts and in that spirit, I’ve got one for you. All you have to do is ask for it.

As a reader of this newsletter, you are probably aware that I advocate using a scorecard to measure your marketing effectiveness. I’ve developed a new version of my scorecard and I’d like to know what you think of it.

I’d like to give you a generic template of my scorecard so that you can customize and use it in your business to measure your marketing. I’ll also include an example to help you understand how to use it. I’ll send it to you as an Excel file so it will be easy to work with.

The scorecard is not designed to be a stand-alone product but rather part of a larger measurement process, so you may need a little help to get started. I’d be happy to provide some guidance by phone or whatever method makes sense.

In exchange, I’ll ask you for some feedback to see if I’m on track with this new version of the scorecard. In general, here are the kinds of things I’ll want to learn about:

  • How was the overall experience of working with this scorecard?
  • How do you feel using the scorecard has helped or could help to improve your marketing effectiveness?
  • Is this approach to measuring marketing suitable for your business?
  • How could the scorecard be improved?
  • What would stop you from using it?

I’m open minded about where our follow up discussion might go and what we might each learn in the process. I think that we should both benefit from this and that we might learn something unexpected.

If you’d like to receive your Optiv8 Christmas gift, email me at rick@optiv8.com and I will send you the scorecard. Please make sure to include your contact information so I can follow up with you in the new year.

I look forward to hearing from you. In the meantime, I’ll be making Christmas cards for my nephews!

Inputs & Outputs

One of the challenges in writing a monthly newsletter is writer’s block. It generally hits me in one of two ways. Either I have no idea what to write about, or I have an idea, but no story or setting for the idea.

I have two approaches to deal with writer’s block. I find that going for a walk in nearby Monarch Park is a great way to clear my head and then somehow the ideas come to me. Finding a story or a setting for my idea can be harder. Something has to happen so I can connect the idea to a story. Usually, I need to read something or get out and do something. Through interacting with a new person or situation, a story sometimes emerges.

Monday evening, faced with neither an idea nor a story for this newsletter, I ventured out to a McGill Alumni event at the Carlu where I could mingle and meet people. Among those I met were two relatively recent graduates (relative to me, that is) with whom I had a very enjoyable, wide ranging conversation. Unfortunately, nothing in our conversation triggered an idea or a story for this month’s newsletter, although I was happy to learn about “The Undercover Economist” Tim Harford, whose writing I’m already enjoying.

On my way home, I thought about other people I’d met lately and then the idea came to me. I realized how a discussion a couple of weeks ago with a highly skilled and experienced market researcher related to how marketing scorecards are an effective way to organize diverse types of data.

We discussed how the various things that can be measured about marketing are either inputs, the things that influence the desired customer behaviour, or outputs, the results of that customer behaviour. This concept can be very helpful in determining how to organize the marketing metrics on your scorecard, and in deciding how to weight them within your overall scoring system. Let’s look at some examples.

Marketing Input Metrics

First of all, there are two broad categories of inputs; those you control and those you don’t. Inputs under your control are generally related to how well you execute the program you are measuring. Examples could include:

  • The percentage of the in-store displays or signs you printed and distributed that were actually and properly put up in store
  • The percentage of all the promotional labels or neck tags your merchandizing partner actually affixed to your products
  • The number of and cost per impression of all your on and off-line marketing communications related to this program

Inputs outside of your control that might impact the success of your program could include:

  • Competitive activity – they dropped or increased their price, promoted heavily while your program was in market, had a PR disaster on Twitter, etc.
  • Weather – no one showed up at your well promoted event because of a massive snow storm

Marketing Output Metrics

There are also two types of outputs, but they are defined a little differently. The first are those outputs or results that are directly attributable to your marketing program. Examples might include:

  • Number of unique visitors to a landing page on your website built for this program
  • Click through rate from your landing page to the buying page
  • Number of new customers who bought using your promotion codes

The other type of outputs are those that are potentially but not definitely or entirely attributable to your program.  These are typically key business performance metrics that can be influenced by a variety of inputs. Examples might include:

  • Revenue for the brand being promoted
  • Market share of that brand
  • Average price per unit sold during the program

Grouping your metrics in this logical fashion on your scorecard can make it easier for you to select your metrics and make decisions about how to weight them by group. Inputs directly under your control and outputs directly attributable to your program should be more heavily weighted than outputs potentially attributable to your program. This is especially true if you tend to have a lot of programs in the market simultaneously. Whatever weightings you use, be consistent over time to ensure you can meaningfully compare programs to each other.

Exclude those inputs outside of your control from your overall calculations. It would be very hard to set objectives and to score against those objectives, or to know how much of an impact they really had. We know that a blizzard of the century will keep more people home than a light dusting of snow, but the amount of snow that makes people decided to stay home is different for everyone. Still, note whether you think external factors significantly impacted your results.

As I wrote this, I realized my opening story does connect to the idea for this newsletter, after all. My story was about an input, an activity under my control, in this case networking and meeting people. That created an output that was at least partially attributable to my networking efforts. I may have still come up with the idea without going to the Carlu, but I might not have found my story!


What Problem do you Want to Solve?

Earlier this week, I did a little light reading on big data. I’ve been hearing a lot about big data lately so I thought I’d investigate.

Truthfully, reading about big data is hardly light reading. Big data presents a big challenge and is emerging as a hot topic in marketing and general business management circles.

What is big data? Well, it’s not about presenting numbers in larger fonts to make it easier for people over 40 years old to read, although I’d probably appreciate something like that. Big data relates to the fact that businesses (and not-for-profits, and governments, etc.) operate in a data rich environment featuring increasingly voluminous, complex and diverse data.

For many organizations, there is more data coming at them than they can handle. The data is evolving rapidly and outgrowing their ability to analyze and glean the insights they need from the data to make better business decisions.

I liked the closing section in this article from which I’ll paraphrase advice from Christer Johnson, IBM’s head of advanced analytics in North America. To get started in tackling big data, first decide what problem you want to solve. That’s great advice in many aspects in life, including big data and it certainly applies to marketing measurement.

I’m reminded of the oft-quoted John Wannamaker, a pioneer of the department store concept in Philadelphia in the 1860s, who famously said:

“I know that half of the money I spend on advertising is wasted; the trouble is I don’t know which half.”

I think of John Wannamaker as one of the founders of the discipline of marketing measurement, as he may have been the first one to define the problem. I’m not convinced he ever solved the problem, but at least he knew what he needed to know. Here’s my take on the problem he was trying to solve.

For context, John’s quote comes from a time with a much less complex marketing environment, before there were any broadcast, internet or mobile media. John’s choice of advertising tactics was probably limited to a few simple options such as:

  • newspaper ads
  • flyers handed out to passers by
  • outdoor signs
  • a guy with a sandwich board on the sidewalk in front of the store
  • a boy cycling around the store, yelling out this week’s specials (a very primitive form of Tweeting)

Yet, in that simple world, John Wanamaker didn’t know which half was wasted. If John were alive today, he’d probably admit that he didn’t even know if it was half, or one quarter or two thirds that was wasted. All he really knew was that some forms of his advertising were more effective than others, and he wanted to know which they were.

With all due respect to John Wannamaker, I’d like to restate his well-known quotation as:

“I know that some of my advertising programs are more effective than others; the trouble is I don’t know which ones. Mostly, I just want to know the best way to spend my money.”

We can modernize this problem statement by substituting the word “advertising” with “marketing” and then it can serve as a starting point for most companies’ marketing measurement efforts. Like John, all managers with a marketing budget need to determine how to optimize that budget to meet or exceed their business objectives.

In these more complex times, with many more marketing tactics to choose from, there is also a lot more data to analyze and understand. Each program may target different customers, using different tactics with different objectives and performance metrics. Gathering the data for those metrics can involve a variety of sources, analytics tools and research techniques.

All that diverse data, big or otherwise, can certainly be a big mess if you don’t have a way to organize and analyze it. The analysis needs to happen in a way that enables comparing each program’s outcomes to the others, so you can identify the best ways to spend your marketing budgets.

A well-designed marketing scorecard can solve this problem. The key is to design your scorecard in a way that makes comparisons between diverse programs meaningful, and helps you to solve the same problem John Wannamaker was trying to solve all those years ago, to find the most effective ways to spend his money.


Measure Well, Sleep Well

If you know me or have been reading this newsletter for any length of time, you may know that photography is my favourite pastime. What you may not know is that organizations sometimes bring me in to take photos of their events, which is how I found myself at the AllerGen 2012 Annual Research Conference.

AllerGen is a not-for-profit organization whose role is to mobilize Canadian science to reduce the illness, mortality and socio-economic costs of allergic disease. The conference showcased the latest research in this regard and while often over my head scientifically (not hard to do), I found it quite interesting.

During an afternoon break at the conference, a distinguished looking gentleman named Douglas Barber approached me to talk photography. Our pleasant conversation eventually shifted to the conference and he told me a story that I quickly realized fit my thinking on marketing measurement.

Douglas explained he is on AllerGen’s board and that an issue of concern to him is the cost to the Canadian economy from the “asthma drag” on productivity. He explained how asthmatics can be less productive at work or even miss entire days of work following sleepless nights caused by asthma. Parents of asthmatic children can also experience the same productivity losses. Douglas also told me how he once did a quick “back of the envelope” calculation to estimate that asthma costs our economy between $10 and $20 billion per year in lost productivity.

Sometime after Douglas did his quick calculation, a full study was done to properly analyze and estimate the economic impact of asthma’s drag on productivity. The study concluded the annual costs are $15 billion. That’s right; a costly and complex measurement process produced the same answer as one expert using a pen and the back of an envelope.

Two aspects of this story relate to my views on marketing measurement:

  • Douglas’s back of the envelope calculation relative to the full study is similar to how a marketing scorecard can be a proxy for a sophisticated and costly marketing measurement process. In both cases, the less sophisticated approach doesn’t need to be perfect, just accurate enough to support analyzing options and making the right decisions. As I like to say, it’s not about precision, it’s about the decision.
  • The back-of-the-envelope estimate worked because it was done by an expert using a sound methodology. Douglas has an extensive business background and apparently knows more than just a little about productivity and related calculations. Scorecards are a proven methodology that you can enhance with expertise about your marketing and your business.

There is another lesson in Douglas’ story, and that’s the need to right size your measurement efforts to the magnitude of the decisions you need to make.

Research Investment Decision

  • Douglas’ back of the envelope calculation and the full-blown study produced essentially the same estimate and both pointed toward making the same decision. It’s a pretty compelling proposition if investing perhaps a few hundred million dollars into research would lead to recovering even just 10%, or $1.5 billion of the lost productivity, especially as that benefit would be realized every year.
  • The problem is that any decision to potentially invest a few hundred million dollars needs to be substantiated by more than a back of the envelope calculation. In this case, the cost of the research needed and the probability of recapturing that 10% are two other variables that I think would need to be estimated. It’s understandable that a full-blown study was needed to examine the overall business case.

Marketing Investment Decision

  • Similarly, for companies that invest tens of millions annually in marketing, it makes sense to support the decisions that need to be made with sophisticated marketing measurement efforts that might cost hundreds of thousands, or more.
  • For most companies with smaller marketing budgets, a practical lower cost approach such as one using a scorecard may well be the right sized measurement solution. In most cases, the overall measurement expense likely needs to be a small single digit percentage of the total marketing budget.

I like simple and elegant solutions that deliver what you need. A marketing scorecard’s simplicity keeps measurement costs down, while its elegance allows the flexibility to include a suitable level of expertise and sophistication to right size your measurement efforts to your marketing budgets.

Whichever measurement approach you choose, be sure to combine a sound methodology with the right expertise to learn what you need to know to make the right decisions. Measuring well will help you to sleep well and be a productive marketer!

Opportunity Knocks!

Last Saturday at around 5pm I was frantically cleaning my house. I had cleaned the bathrooms, vacuumed, swept and dusted, and was about to wash the kitchen floor when it suddenly hit me. I was wasting my time.

Sensing an opportunity, I wisely settled into my favourite comfy chair, put my feet up and took a nap. This was a much better use of my time than washing the kitchen floor, especially considering the night ahead. Here’s why.

At roughly 8pm that night, the first of 50 or so of my friends would begin knocking on my front door to attend my annual spring party. I knew that many of the 50 would gather in the kitchen.  All those feet would be guaranteed to make for a dirty floor, which I would have to wash again after the party.

The additional benefit of washing that floor before the party would be negligible, at best. I’d feel good about my clean floor (which no one else would notice), but only until all those feet arrived (with friends attached) and began to mess it up. On the other hand, a nap would really boost my energy for the evening.

Excessive investments of time and energy into house cleaning prior to a party are adversely affected by the law of diminishing marginal returns. (Try quoting me if you need to get out of a cleaning chore sometime!) For each extra cleaning investment, you get less and less back in terms of the quality of the party or the guests’ enjoyment of it. While a house needs to be clean enough to be presentable, it doesn’t need to pass the white glove test.

Similarly, investments of time, money and people into marketing measurement are also impacted by diminishing marginal returns. You shouldn’t overspend on measurement and it doesn’t need to be perfect or pass the measurement equivalent of a white glove test. It just needs to be good enough to help you to make better decisions. Consider the following visual:


The vertical axis represents the resources you invest (money, time, people) to measure your marketing. The horizontal axis represents what you learn from those measurement investments that help you to make better marketing decisions, thus improving your marketing effectiveness.

The curve represents my view of the rate at which incremental measurement investments improve marketing decision quality. Generally, the more you invest in measurement, the better your marketing decisions get, but it’s not a straight linear relationship.

Let’s look at this curve in each of the three zones separated by the two red horizontal lines, starting from the bottom zone.

Bottom Zone

  • Characteristics: Starting at zero on both axes, as you begin to measure you very quickly learn things that can improve marketing decisions. Most organizations in this zone have very small marketing budgets, and few resources, so it may not be possible to invest much in measurement, nor are there many marketing decisions to improve.
  • Recommended Strategy: Take advantage of no or low cost measurement tools and internal data. Measure anything and you will likely learn something useful.

Middle Zone

  • Characteristics: Organizations in this “Opportunity Zone” have marketing budgets that are big enough to be worth measuring, and can allocate a small percentage of their budget to measurement. The opportunity in this zone is that small investments pay off quite nicely in the way of improved marketing decisions. The return from better decisions shows up as lower or more efficient marketing expense, and higher revenue and profit.
  • Recommended Strategy:  Consistently apply a disciplined and practical approach to learn what you need to know to improve decisions. Resist the temptation to over invest in the more sophisticated (and expensive) measurement solutions that will bring you closer to the steepening section of the curve where you get a lower return for your incremental investments.

Top Zone

  • Characteristics: Here we see the most severely diminished marginal returns from measurement investments. It takes significant additional investments to yield even the slightest improvements in decisions. Only the largest of organizations with enormous marketing budgets can play successfully in this zone, as small market share gains and sales lifts can be very profitable. Other characteristics of this zone will include a lot of complex data and sophisticated measurement techniques.
  • Recommended Strategy:  Question every bit of measurement spending. Just as there is great opportunity to learn at the lower end of the curve, on the upper end there is equally great opportunity to reduce measurement costs without significantly damaging decision quality.

That’s the way I see the relationship between measuring your marketing and how it helps you to get better results. There are exceptions to every rule, but the law of diminishing marginal returns is one of economics’ most powerful laws, so ignore it at your peril.

Have you identified which zone of the curve you’re in? There are a lot of organizations in the bottom and middle zones, who may not currently measure their marketing, or who aren’t happy with their efforts to do so. If that sounds like your organization, a great opportunity knocks at your door!

In the meantime, if you need me, I’ll be in the kitchen mopping the floor!

Warren and Me

While reading my good friend Warren Buffett’s 2010 letter to his Berkshire Hathaway shareholders, I found myself smiling and nodding on several occasions. Before I explain, I should point out that Warren and I are not actually friends; I just said that so you’d keep reading. I suppose it would be fair to say that I know Warren a lot better than he knows me, which is not at all.

The reason I referred to Warren as a friend, aside from the attention grabbing value of doing so, is that when I read his various comments about how he measures his company’s performance, I saw many parallels to my own views on measuring marketing performance. In that sense, we are friends. Here are a few examples featuring excerpts from Warren’s well crafted letter.

Example 1

  • Warren: “I believe that those entrusted with handling the funds of others should establish performance goals at the onset of their stewardship. Lacking such standards, managements are tempted to shoot the arrow of performance and then paint the bull’s-eye around wherever it lands.”
  • Me: Those managing marketing budgets have the same responsibility. Set performance goals up front so everyone is clear on how marketing spending will be judged. Selecting goals after the fact introduces a bias towards using metrics that prove marketing worked rather than determining whether it worked.

Example 2

  • Warren: “Our job is to increase per-share intrinsic value at a rate greater than the increase (including dividends) of the S&P 500.” … “The challenge, of course, is the calculation of intrinsic value. Present that task to Charlie (Vice Chairman, Charlie Munger) and me separately, and you will get two different answers. Precision just isn’t possible.” … “To eliminate subjectivity, we therefore use an understated proxy for intrinsic value – book value – when measuring our performance.”
  • Me: Marketing’s duty is to run programs whose objectives align with those of the organization. Any business exists to make money but, I don’t try to measure the exact financial ROI of each program because I feel that type of precision just isn’t possible. My proxy for ROI is to measure program results against their objectives, which should be focused on driving profitable customer activity and creating value for the business.

Example 3

  • Warren: In writing about how he values Berkshire, Warren explains why he doesn’t use net income as a metric. “Regardless of how our business might be doing, Charlie and I could – quite legally – cause net income in any given period to be almost any number we would like.”
  • Me: Choose metrics that are reliable and meaningful, and above suspicion of being manipulated to tell the story you want to tell. You want the people that matter to trust that your numbers accurately reflect the truth, not your version of the truth.

Example 4

  • Warren: Berkshire uses a well accepted accounting standard (Black-Scholes) for valuing option contracts, a standard that Warren doesn’t seem to like because under certain circumstances it can produce “wildly inappropriate values”. On this, Warren writes “Part of the appeal of Black-Scholes to auditors and regulators is that it produces a precise number. Charlie and I can’t supply one of those.” … “Our inability to pinpoint a number doesn’t bother us: We would rather be approximately right than precisely wrong.”
  • Me: I love that last sentence! There is a natural inclination to want to measure marketing precisely but I don’t think a high level of precision is needed to make good decisions. If you can be approximately right at identifying which marketing programs were most and least effective at meeting their objectives and creating value for your business, then you can make very good decisions that will optimize your marketing effectiveness.

I was glad to read how Warren’s point of view aligns with my thinking on marketing measurement. Any good measurement process just needs to be right enough to be an effective decision support tool. We need to measure the right things well enough that we learn what we need to know to make better decisions.

Warren and I may not be friends, but he’s a guy that I’d love to sit down with, have a hamburger (he apparently loves hamburgers) and soak up any wisdom he’d like to share. Since that’s not likely to happen, I’ll have to make do with a pretty good letter from a wise man.

PS. If you’d like to read Warren’s full letter, you can find it at the Berkshire Hathaway website: http://www.berkshirehathaway.com/letters/2010ltr.pdf

Return On Corona

My friend Dan was in town recently.  Our friendship goes back to our university days at McGill, which is another way of saying we’ve known each other for a very long time.  Of course, we’ve both aged quite gracefully.  We get together when we can, and when Dan had to be in town for meetings a couple of weeks ago, we made plans for Saturday night.

Dan and I decided to get caught up while watching a rare live performance of their Paul McCartney tribute called ‘Getting Better’ by my musician friends, The Weber Brothers.  The guys delivered a great performance, as always, with a set list that included ‘Yesterday’, ‘Let It Be’ and ‘Maybe I’m Amazed‘.  I was also thankful that Ryan and Sam Weber chose not to perform ‘Silly Love Songs’.

Whenever we get together, Dan and I usually pass some of our time updating each other on our business endeavours.  I always enjoy hearing Dan’s perspective and he usually asks great questions that help me to focus on the right issues.

As we discussed my marketing measurement work, Dan questioned whether I measure Return On Investment (ROI), which is a natural question and one I’m commonly asked.  My answer went something like this.

As we sat at the bar, I looked down at the clear glass bottle in my right hand.  I said, “Let’s use my Corona as an example.  I don’t remember what marketing program caused me to try it years ago for the first time, I can’t tell you why it’s among the half dozen or so brands that I tend to order, and I don’t know what caused me to order it tonight.”

Corona

Let’s suppose Molson-Coors made $0.50 profit on the sale of my one bottle.  To calculate the ROI on their marketing for this transaction, they’d have to understand which marketing investments influenced my buying decision, and by how much.  Here are some thoughts on their marketing programs that I can recall:

  • I know I like watching their commercials
  • I’m sure I’ve seen several print ads, and the image of their clear glass bottle sparkling in the sun and a wedge of lime lingers in my mind
  • Not too long ago, I noticed a contest to win a bar fridge
  • I remember a great poolside bar promotion while vacationing at an all-inclusive a few years back that likely still influences my purchases.

Those are the ones I can recall, but I’m sure there are others I don’t remember that have influenced me.  Here’s where calculating ROI gets more complicated.

  • I have no idea which of these marketing investments influenced me most, or least, nor how much of the $0.50 profit to attribute to each.
  • I can’t begin to consider how to account for the combined impact of all those marketing investments that somehow accumulate within me over the years to influence my buying decisions.

The key point is, if I can’t do the profit allocation for my own buying decision, even if Molson-Coors could somehow get inside my head and have a good look around (it wouldn’t take long…) they wouldn’t figure it out either. To further complicate things, all their other customers each have their own influences and reasons for buying.

We humans each make our own very complex buying decisions, often influenced by factors outside the marketers’ control, in ways we may not consciously understand.  It’s extremely difficult and costly to isolate all the variables involved to truly and accurately measure financial return on investment of marketing spending. We end up having to make too many assumptions, or guesses at allocations.

However, this doesn’t mean we shouldn’t measure something.  Instead of ROI, I focus on measuring how effective marketing is at meeting objectives, using metrics that involve as few assumptions as possible.  Here are a few thoughts on metrics:

  • Rather than trying to focus on one killer metric, like ROI, select a group of metrics that together give you a balanced view of whether a specific marketing program drove value in your business.
  • Assemble your various metrics in a scorecard that allows you to evaluate each metric against its objectives.
  • Decide which metrics you want to use before you launch your marketing program in case you need to gather data while the program is in market.
  • Just because I’m letting you off the hook on measuring ROI, it doesn’t mean you should ignore financial metrics.  Your scorecard should definitely include financial metrics, such as revenue, and average transaction value, which tends to be a good indicator of profit.

I’m not comfortable making decisions or recommendations supported by numbers that are based on a lot of assumptions or guesses.  Build your marketing measurement process on as many facts and clean data as you can find.

Oh, and one more thought.  My Return On Corona (ROC) a couple of Saturdays ago was exceptional, given my objectives to hang out with a great friend and to be entertained by talented musicians!