Big Data, Small Data


Introduction

Marketing measurement is a big problem, but the solution to the problem doesn’t also have to be big. In fact, it can be small.

This month’s post is about taking a small data approach to a big marketing problem.

_______________________________________________________________________________________


On Monday afternoon, I met my friend Reuben to get caught up over a coffee. I always enjoy our chats as they usually cover a wide range of interesting topics. Reuben also tends to ask great questions and make insightful comments. Monday was no exception.

While discussing how pervasive technology, analytics and big data are in marketing, we concluded that in contrast to all of that complexity and big data, I come at marketing measurement from a different angle; with something we might call a small data approach.

There is an emerging definition of small data as the few key pieces of meaningful, actionable information that we can uncover by analyzing big data. Those insights you extract from your big data become the last steps along the way to making better marketing decisions.

Actually, neither one of us had that definition of small data in mind during our discussion. Rather, we spoke of my “small data” approach to marketing measurement as small relative to other approaches and to the complexity of the problem.

My approach does align with the above definition of small data in the sense that I am very focused on organizing the chaos of all that data, uncovering insights and helping marketers to learn what they need to know so they can make better decisions. That is the reason to measure marketing and it needs to be the focus of any approach to measuring marketing.

Where my scorecard-based approach might also seem a bit contrarian is in its emphasis on measuring results vs. objectives and in not trying to calculate a financial return on investment (ROI). Although it would be ideal to accurately measure the financial ROI of marketing programs, as I have written about in the past, I think there are too many problems with doing financial ROI calculations for individual marketing programs.

I’ve always thought of my approach as a practical approach to a complex problem. As of Monday afternoon, I’m also starting to think about it as a small data approach to a big data problem. To explain what I mean by a small data approach, let me start with some thoughts on big data.

Big Data

Big data flows out of a set of circumstances that will tend to occur at bigger companies, and might include some combination of the following:

  • Big marketing budgets
  • Many marketing programs
  • Many products and/or services
  • Many communications channels
  • Many and diverse customers and customer segments
  • Many touch points on the customer path-to-purchase
  • Many transactions

These circumstances lead to a whole lot of data to analyze and understand which in turn leads to big data measurement solutions that will also tend to be big, complex, sophisticated and expensive.

With all the buzz around big data, it is easy for small and mid-sized companies to conclude that a high-science, big data solution must be the only legitimate way to approach marketing measurement. For many of these companies, a big, costly sophisticated approach isn’t needed or practical under their circumstances. A smaller, more practical approach can do the trick.

Small Data

Most small to mid-sized companies don’t operate under the same set of circumstances. Their budgets aren’t as big, their marketing activity is much less involved, their world is much less complex and they generate and collect a smaller amount of data. They also have fewer resources with which to take on the problem that all marketers must solve, which is to determine the best ways to invest their budgets.

A small data approach can be a great fit under these smaller circumstances. Yet, given the range of company size and marketing activity within the small to medium sized businesses segment, a one-size-fits-all approach doesn’t work. Any approach needs to have some built in flexibility so you can scale up or down to be appropriate for the size of the marketing budget being measured.

That’s really where I stand on marketing measurement. Right size your approach to your circumstances, and don’t overspend on measurement by bringing an over-sized solution to your problem.

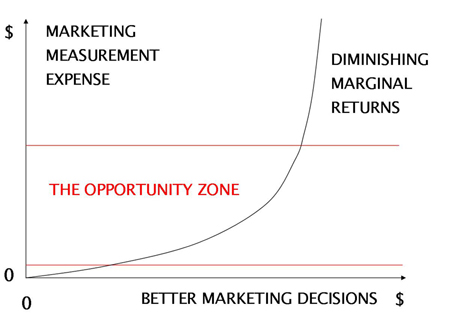
Don’t over allocate resources to measuring something that you can’t measure perfectly, as the law of diminishing marginal returns will ensure you waste some of those precious resources. This is not about measuring perfectly; it’s about perfecting your marketing.

_______________________________________________________________________________________

About the Author: Rick Shea is President of Optiv8 Consulting, a marketing effectiveness consultancy with a focus on helping small to mid-sized organizations measure their marketing so they can stop wasting money.

Copyright ©2014 Optiv8 Consulting.  All rights reserved.

You may reproduce this article by including this copyright and, if reproducing electronically, including a link to:  http://www.optiv8.com/

Measure Well, Sleep Well

If you know me or have been reading this newsletter for any length of time, you may know that photography is my favourite pastime. What you may not know is that organizations sometimes bring me in to take photos of their events, which is how I found myself at the AllerGen 2012 Annual Research Conference.

AllerGen is a not-for-profit organization whose role is to mobilize Canadian science to reduce the illness, mortality and socio-economic costs of allergic disease. The conference showcased the latest research in this regard and while often over my head scientifically (not hard to do), I found it quite interesting.

During an afternoon break at the conference, a distinguished looking gentleman named Douglas Barber approached me to talk photography. Our pleasant conversation eventually shifted to the conference and he told me a story that I quickly realized fit my thinking on marketing measurement.

Douglas explained he is on AllerGen’s board and that an issue of concern to him is the cost to the Canadian economy from the “asthma drag” on productivity. He explained how asthmatics can be less productive at work or even miss entire days of work following sleepless nights caused by asthma. Parents of asthmatic children can also experience the same productivity losses. Douglas also told me how he once did a quick “back of the envelope” calculation to estimate that asthma costs our economy between $10 and $20 billion per year in lost productivity.

Sometime after Douglas did his quick calculation, a full study was done to properly analyze and estimate the economic impact of asthma’s drag on productivity. The study concluded the annual costs are $15 billion. That’s right; a costly and complex measurement process produced the same answer as one expert using a pen and the back of an envelope.

Two aspects of this story relate to my views on marketing measurement:

  • Douglas’s back of the envelope calculation relative to the full study is similar to how a marketing scorecard can be a proxy for a sophisticated and costly marketing measurement process. In both cases, the less sophisticated approach doesn’t need to be perfect, just accurate enough to support analyzing options and making the right decisions. As I like to say, it’s not about precision, it’s about the decision.
  • The back-of-the-envelope estimate worked because it was done by an expert using a sound methodology. Douglas has an extensive business background and apparently knows more than just a little about productivity and related calculations. Scorecards are a proven methodology that you can enhance with expertise about your marketing and your business.

There is another lesson in Douglas’ story, and that’s the need to right size your measurement efforts to the magnitude of the decisions you need to make.

Research Investment Decision

  • Douglas’ back of the envelope calculation and the full-blown study produced essentially the same estimate and both pointed toward making the same decision. It’s a pretty compelling proposition if investing perhaps a few hundred million dollars into research would lead to recovering even just 10%, or $1.5 billion of the lost productivity, especially as that benefit would be realized every year.
  • The problem is that any decision to potentially invest a few hundred million dollars needs to be substantiated by more than a back of the envelope calculation. In this case, the cost of the research needed and the probability of recapturing that 10% are two other variables that I think would need to be estimated. It’s understandable that a full-blown study was needed to examine the overall business case.

Marketing Investment Decision

  • Similarly, for companies that invest tens of millions annually in marketing, it makes sense to support the decisions that need to be made with sophisticated marketing measurement efforts that might cost hundreds of thousands, or more.
  • For most companies with smaller marketing budgets, a practical lower cost approach such as one using a scorecard may well be the right sized measurement solution. In most cases, the overall measurement expense likely needs to be a small single digit percentage of the total marketing budget.

I like simple and elegant solutions that deliver what you need. A marketing scorecard’s simplicity keeps measurement costs down, while its elegance allows the flexibility to include a suitable level of expertise and sophistication to right size your measurement efforts to your marketing budgets.

Whichever measurement approach you choose, be sure to combine a sound methodology with the right expertise to learn what you need to know to make the right decisions. Measuring well will help you to sleep well and be a productive marketer!

Opportunity Knocks!

Last Saturday at around 5pm I was frantically cleaning my house. I had cleaned the bathrooms, vacuumed, swept and dusted, and was about to wash the kitchen floor when it suddenly hit me. I was wasting my time.

Sensing an opportunity, I wisely settled into my favourite comfy chair, put my feet up and took a nap. This was a much better use of my time than washing the kitchen floor, especially considering the night ahead. Here’s why.

At roughly 8pm that night, the first of 50 or so of my friends would begin knocking on my front door to attend my annual spring party. I knew that many of the 50 would gather in the kitchen.  All those feet would be guaranteed to make for a dirty floor, which I would have to wash again after the party.

The additional benefit of washing that floor before the party would be negligible, at best. I’d feel good about my clean floor (which no one else would notice), but only until all those feet arrived (with friends attached) and began to mess it up. On the other hand, a nap would really boost my energy for the evening.

Excessive investments of time and energy into house cleaning prior to a party are adversely affected by the law of diminishing marginal returns. (Try quoting me if you need to get out of a cleaning chore sometime!) For each extra cleaning investment, you get less and less back in terms of the quality of the party or the guests’ enjoyment of it. While a house needs to be clean enough to be presentable, it doesn’t need to pass the white glove test.

Similarly, investments of time, money and people into marketing measurement are also impacted by diminishing marginal returns. You shouldn’t overspend on measurement and it doesn’t need to be perfect or pass the measurement equivalent of a white glove test. It just needs to be good enough to help you to make better decisions. Consider the following visual:


The vertical axis represents the resources you invest (money, time, people) to measure your marketing. The horizontal axis represents what you learn from those measurement investments that help you to make better marketing decisions, thus improving your marketing effectiveness.

The curve represents my view of the rate at which incremental measurement investments improve marketing decision quality. Generally, the more you invest in measurement, the better your marketing decisions get, but it’s not a straight linear relationship.

Let’s look at this curve in each of the three zones separated by the two red horizontal lines, starting from the bottom zone.

Bottom Zone

  • Characteristics: Starting at zero on both axes, as you begin to measure you very quickly learn things that can improve marketing decisions. Most organizations in this zone have very small marketing budgets, and few resources, so it may not be possible to invest much in measurement, nor are there many marketing decisions to improve.
  • Recommended Strategy: Take advantage of no or low cost measurement tools and internal data. Measure anything and you will likely learn something useful.

Middle Zone

  • Characteristics: Organizations in this “Opportunity Zone” have marketing budgets that are big enough to be worth measuring, and can allocate a small percentage of their budget to measurement. The opportunity in this zone is that small investments pay off quite nicely in the way of improved marketing decisions. The return from better decisions shows up as lower or more efficient marketing expense, and higher revenue and profit.
  • Recommended Strategy:  Consistently apply a disciplined and practical approach to learn what you need to know to improve decisions. Resist the temptation to over invest in the more sophisticated (and expensive) measurement solutions that will bring you closer to the steepening section of the curve where you get a lower return for your incremental investments.

Top Zone

  • Characteristics: Here we see the most severely diminished marginal returns from measurement investments. It takes significant additional investments to yield even the slightest improvements in decisions. Only the largest of organizations with enormous marketing budgets can play successfully in this zone, as small market share gains and sales lifts can be very profitable. Other characteristics of this zone will include a lot of complex data and sophisticated measurement techniques.
  • Recommended Strategy:  Question every bit of measurement spending. Just as there is great opportunity to learn at the lower end of the curve, on the upper end there is equally great opportunity to reduce measurement costs without significantly damaging decision quality.

That’s the way I see the relationship between measuring your marketing and how it helps you to get better results. There are exceptions to every rule, but the law of diminishing marginal returns is one of economics’ most powerful laws, so ignore it at your peril.

Have you identified which zone of the curve you’re in? There are a lot of organizations in the bottom and middle zones, who may not currently measure their marketing, or who aren’t happy with their efforts to do so. If that sounds like your organization, a great opportunity knocks at your door!

In the meantime, if you need me, I’ll be in the kitchen mopping the floor!

Return On Corona

My friend Dan was in town recently.  Our friendship goes back to our university days at McGill, which is another way of saying we’ve known each other for a very long time.  Of course, we’ve both aged quite gracefully.  We get together when we can, and when Dan had to be in town for meetings a couple of weeks ago, we made plans for Saturday night.

Dan and I decided to get caught up while watching a rare live performance of their Paul McCartney tribute called ‘Getting Better’ by my musician friends, The Weber Brothers.  The guys delivered a great performance, as always, with a set list that included ‘Yesterday’, ‘Let It Be’ and ‘Maybe I’m Amazed‘.  I was also thankful that Ryan and Sam Weber chose not to perform ‘Silly Love Songs’.

Whenever we get together, Dan and I usually pass some of our time updating each other on our business endeavours.  I always enjoy hearing Dan’s perspective and he usually asks great questions that help me to focus on the right issues.

As we discussed my marketing measurement work, Dan questioned whether I measure Return On Investment (ROI), which is a natural question and one I’m commonly asked.  My answer went something like this.

As we sat at the bar, I looked down at the clear glass bottle in my right hand.  I said, “Let’s use my Corona as an example.  I don’t remember what marketing program caused me to try it years ago for the first time, I can’t tell you why it’s among the half dozen or so brands that I tend to order, and I don’t know what caused me to order it tonight.”

Corona

Let’s suppose Molson-Coors made $0.50 profit on the sale of my one bottle.  To calculate the ROI on their marketing for this transaction, they’d have to understand which marketing investments influenced my buying decision, and by how much.  Here are some thoughts on their marketing programs that I can recall:

  • I know I like watching their commercials
  • I’m sure I’ve seen several print ads, and the image of their clear glass bottle sparkling in the sun and a wedge of lime lingers in my mind
  • Not too long ago, I noticed a contest to win a bar fridge
  • I remember a great poolside bar promotion while vacationing at an all-inclusive a few years back that likely still influences my purchases.

Those are the ones I can recall, but I’m sure there are others I don’t remember that have influenced me.  Here’s where calculating ROI gets more complicated.

  • I have no idea which of these marketing investments influenced me most, or least, nor how much of the $0.50 profit to attribute to each.
  • I can’t begin to consider how to account for the combined impact of all those marketing investments that somehow accumulate within me over the years to influence my buying decisions.

The key point is, if I can’t do the profit allocation for my own buying decision, even if Molson-Coors could somehow get inside my head and have a good look around (it wouldn’t take long…) they wouldn’t figure it out either. To further complicate things, all their other customers each have their own influences and reasons for buying.

We humans each make our own very complex buying decisions, often influenced by factors outside the marketers’ control, in ways we may not consciously understand.  It’s extremely difficult and costly to isolate all the variables involved to truly and accurately measure financial return on investment of marketing spending. We end up having to make too many assumptions, or guesses at allocations.

However, this doesn’t mean we shouldn’t measure something.  Instead of ROI, I focus on measuring how effective marketing is at meeting objectives, using metrics that involve as few assumptions as possible.  Here are a few thoughts on metrics:

  • Rather than trying to focus on one killer metric, like ROI, select a group of metrics that together give you a balanced view of whether a specific marketing program drove value in your business.
  • Assemble your various metrics in a scorecard that allows you to evaluate each metric against its objectives.
  • Decide which metrics you want to use before you launch your marketing program in case you need to gather data while the program is in market.
  • Just because I’m letting you off the hook on measuring ROI, it doesn’t mean you should ignore financial metrics.  Your scorecard should definitely include financial metrics, such as revenue, and average transaction value, which tends to be a good indicator of profit.

I’m not comfortable making decisions or recommendations supported by numbers that are based on a lot of assumptions or guesses.  Build your marketing measurement process on as many facts and clean data as you can find.

Oh, and one more thought.  My Return On Corona (ROC) a couple of Saturdays ago was exceptional, given my objectives to hang out with a great friend and to be entertained by talented musicians!