How Engaged Is Your Audience?

Introduction

As content marketing grows in importance, it is worth questioning and measuring how engaged your audience is by your content, and whether they are engaging in the way you would like. This post outlines a practical approach to answering this question.

In the foreground, an engaged macaque. In the background, not so much...

In the foreground, an engaged macaque. In the background, not so much…

First words are magical moments. You may not remember the exact moment when you spoke your first word, but I expect your parents remembered and told you what you said. What was your first word?

My parents happily told me many times that my first word was “light”, although I suspect they secretly would have preferred something closer to “mom” or “dad”.

Can you imagine a more engaged audience than parents listening to their child’s first words? They engage fully in the whole experience; from their encouragement in the lead up to the first word, to the excitement of the moment  and the pride that follows. That’s an engaged audience. That’s why they remember your first word.

Of course, the relationship between a business and its customers is rather different, and customers will tend to be considerably less engaged than parents. Still, as content marketing grows in importance, the question you need to ask is: “How engaged is your audience by your content?”

On the continuum of engaged audiences, on a scale from 0 to 100, most parental audiences are 100% engaged. When I develop marketing content, for myself or for my clients, I hope to engage my audience on the higher end of the scale, and so should you. It’s a lofty ambition, and I expect to fall a little short, but it’s better than the other end where no one reads, cares or reacts.

So, how do you measure where your audience is on the engagement scale? Well, it helps to have a scale to answer that question. Here are four steps to developing your scale, with the first step being:

1. Define Your Engagement Continuum

Start by defining a general continuum for outcomes related to your content marketing activities, keeping in mind their relevance to your overall business objectives. There isn’t necessarily one right way to do this and you don’t need to assign numerical values to everything between 0 and 100%.

Engagement ContiuumThe main point is to think about the engagement objectives of your content marketing in ascending order of importance. What do you want your audience to do? Which outcomes are most helpful in meeting your business objectives? Defining your engagement continuum will help you to have greater clarity about what you are trying to achieve with your content and how you define success.

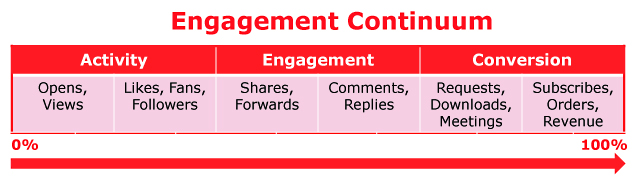
Thinking about how your prospects engage with your content is similar to how we might think about how prospects engage with us in a sales funnel, with Opens and Views being top-of-funnel activities, leading down through to the preferred conversions at the bottom of the funnel, such as Subscribes or Orders.

Then, you can adjust your continuum for each specific content marketing program or initiative. For some programs, the hoped for conversion might be a sale to an existing customer, or to a new customer. In others, the program objectives might relate more to building an audience or moving prospective customers along the path to purchase, and generating quality leads.

Defining your Engagement Continuum ties directly to the second step:

2. Define Your Metrics

Your metrics are the units of measurement on the engagement continuum. As I’ve written about previously here, I like to organize metrics into three groups, Activity, Engagement and Conversion, which also fit logically along the engagement continuum.

Ruler

The simplest activity metrics, such as opens and views, can lead to early signs of engagement, through counts of likes, fans and followers. The more engaged audience goes beyond those activities to share, forward and comment on your content.

The very engaged might convert to requesting more information or downloading something. Ideally, they will purchase something, or refer a new customer to you. For some content, your objectives might be to gain more subscribers or registrations for something.

Let’s consider metrics for this post, as an example. LinkedIn provides data on three metrics related to each post: Views, Likes and Comments. I track how many Followers I add as a result of each post. I also note the number of emails or phone calls I receive from prospective clients, triggered by each post.

To those five metrics, I add two engagement ratios, which normalize my data and give me a sense of which pieces of content have been most effective at engaging the audience that actually saw my content. In this case, I’ll create ratios for Likes as a % of Views, and Comments as a % of Views.

That gives me a total of seven metrics that help me to understand if my content is engaging my audience. The third step involves scoring my results for those metrics.

3. Score Your Results

To give meaning to your metrics, you need to be able to answer the question “How good is that number?” Scoring your result takes you from merely counting, to measuring.

Continuing with my example above, now that I have seven previous LinkedIn posts under my belt, I can compare each of my seven engagement metrics for this post to my averages for those same metrics on my previous posts. I could also compare it to the averages of similar posts by other publishers on LinkedIn.

Ideally, the results of any marketing initiative should be compared to a corresponding set of objectives. I could use my averages as my objectives, but I’ll generally put a bit of stretch into the objective by aiming higher than my averages. I score my results by expressing them as a percentage of the objective.

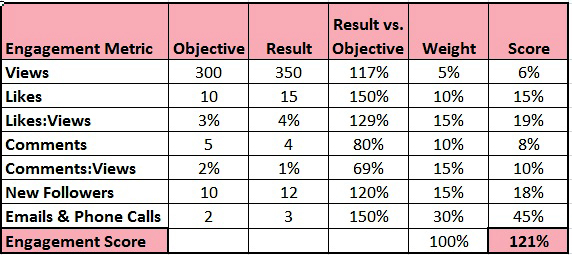
For example, I’ve averaged around 250 views for each of my first seven posts. Rather than set an objective of 250 for this one, I’ll set it at 300. If I end up getting 350 views, then my score on that metric will be 350/300 X 100 = 117%.

Now it’s time to put all seven of my scores on a scale.

4. Create Your Scale

Given that your metrics will likely vary from program to program, you will need a flexible way to score and total your results for the range of metrics associated with each program.

For that, I advocate using a standardized scorecard that will accommodate the diverse audience engagement data that you’ll collect for each program. Using a consistent scorecard methodology for measuring audience engagement for each post gives me a way to rank my posts. That ranking helps me to learn what type of content seems most relevant to my audience, and the ability to act on that knowledge and hopefully create more engaging content.

Some metrics are more important than others. So, weight the metrics on your scorecard according to the importance you’ve assigned them by where you placed them on the engagement continuum. Conversion metrics should be weighted higher than Engagement metrics, with Activity metrics weighted lower than the others.

Your scorecard gives you an easy way to total up the weighted scores for each metric as you compare each result to its objective. Below is a simplified example of a scorecard that I use to score each post.

Audience Engagement Scorecard

Summary

It’s nice to think that your audience is parentally engaged, waiting for your next piece of content with great anticipation and hanging on your every word as they read, listen or watch. While that is highly unlikely, it is worth trying to understand which pieces of content come closest to that ideal, so you can focus on creating more of that kind of content.

Creating good content takes time and effort, so you might as well put in a little additional effort towards measuring and understanding whether you’ve succeeded at engaging your audience.

As with most marketing measurement exercises, your science will be inexact. However, if you apply your measurement efforts in a consistent and disciplined manner, your measurement results will be directional enough to help steer you towards better decisions that focus and improve your content marketing activities.

If I’ve engaged you enough that you’d like me to send you an excel file with the above example of an Audience Engagement Scorecard that you can customize for your own use, please email me and I’ll happily send it to you. Of course, I’d appreciate it if you could share this post with any individuals or audiences you feel might also like to be engaged!

A Note of Caution


Introduction

I had an interesting experience at the bank the other day so I thought I’d tell you about it. I was a little worried about what might happen at the bank, just as you might worry about deciding which marketing programs to execute.

It turned out that I had nothing to worry about and if you measure your marketing, and follow my five measurement principles, you can ease your worries, too!

_______________________________________________________________________________________


As I handed the bank teller my carefully crafted note, I worried about how things were going to turn out. I had taken a cautious approach with my note, but I couldn’t control or anticipate the teller’s reaction.

Normally, notes handed to bank tellers might say something like “This is a hold-up” or “Put all the money in a bag” or in Woody Allen’s case, “Abt natural, I’m pointing a gub at you”. My circumstances were different, so I needed a different approach.

For one thing, I actually wanted to GIVE the bank some money. Well, not exactly “give”. I wanted to deposit a cheque from one of my clients into my business account. The other circumstance at play was that I couldn’t speak, not one word.

Before you start thinking that I bank at one of those new all silent branches, allow me to explain by sharing the content of my note:

“I’m sorry; I can’t speak temporarily while I recover from vocal cord surgery. I’d like to deposit this cheque into my account.”

Thankfully, the teller didn’t panic, the deposit went smoothly and I escaped the bank silently, without speaking a word to anyone.

It is natural to worry about taking actions or making decisions with uncertain outcomes. It is also natural to want better information to help us make better choices.

Marketers face difficult decisions and a lot of uncertainty every time they have to choose which programs to fund in their efforts to attract and acquire customers. In the absence of data or evidence of how similar programs might have performed in the past, such spending decisions become significantly more difficult.

To improve your ability to make good marketing spending decisions, you need good data about the performance of past marketing programs. The purpose of marketing measurement is to support making better marketing spending decisions.

There are many ways to approach marketing measurement. Whatever approach you take, be sure to follow these:

Five Marketing Measurement Principles

1. Pick & Stick: Choose one measurement methodology, apply it consistently across all programs and stick with it. Without measurement consistency, you end up with silos of data around each program that are difficult to analyze and compare.

2. Set Good Objectives: You’ll need to measure your results against your objectives. Integrate measurement into your marketing planning to force setting well-defined and measurable marketing objectives, for the overall organization, the brand and for each program.

3. Involve the Right People: Measurement works best when you have input and support from other parts of the organization. You will need other key individuals to agree that your approach is sound and that the results of your measurement efforts are meaningful. You may also need them to provide you with good data.

4. Use Good Data: Whether you use a complex and sophisticated methodology, or a scorecard, it won’t matter how good your approach is if your data is garbage. Be hard on the quality and reliability of your data to properly support your measurement methodology.

5. Compare & Learn: To learn what works and what doesn’t, and to find the best ways to spend your budget, you need to compare results to objectives and programs to each other. Seek answers to questions like:

  • Did we get the results we wanted for the company, for the brand and for the program?
  • Which of our programs, and in general which types of programs, seem to be the most and least effective at delivering the results we need to meet our business objectives?

When I handed my note to the teller, I was worried about startling or upsetting her and hoped I wouldn’t need to engage in any further communication beyond a nod, a smile or a thumbs up. When you have to decide how to allocate your marketing budget, your worries relate to serious things like meeting business objectives, achieving personal performance goals and advancing your career.

To worry less and to improve your marketing decisions, make sure you have a solid approach to measuring your marketing. It will give you better information about what works and what doesn’t, your decisions will improve and the business results will follow.

As for me, I’m glad I didn’t end up like Woody Allen’s character Virgil Starkwell in ‘Take the Money and Run’!


A Chapter About Bruce


Introduction

Are the objectives for your marketing programs really just reasons without numbers? Well, with some inspiration from a seed planted by a song I first heard in 1975, I’ll try to help you to fix that problem.

_______________________________________________________________________________________


I’m a long-time Bruce Springsteen fan. My affliction set in the first time I heard Born to Run played on my local FM station. I remember it well. It was the fall of 1975 and I was sitting in the basement of our family home, pretending to do homework.

When I decided several years ago to learn about blogging, I wanted to do so outside of my work world. I chose to blog about Bruce as I had studied him more diligently.

The blog was fun, I learned what I needed to know, but after five years of weekly posts, I lost the enthusiasm to keep going. I stopped posting at the end of 2012, although I have kept the blog site up. I’m happy I did it and the blog opened doors for me that I never anticipated.

Recently, a new door cracked open. I’ve been asked to consider writing a chapter in a book about Bruce that one day will hopefully be published. The asker found me through my blog.

I haven’t made my decision yet but I’m thinking about it and why I might like to do this. That leads me to the point of this story. I want to illustrate the difference between having reasons for doing something and setting proper objectives for doing that something.

Reasons may give you purpose, but proper objectives give you the ability to measure whether you achieved what you set out to accomplish. To measure whether marketing programs achieve their purpose, you need to be able to compare results to objectives.

I have to decide whether to commit my resources to writing this chapter, in the hopes it will be accepted and published. Similarly, you have to decide whether to support and run specific marketing programs, in the hopes they will move your business forward.

Setting Clear Objectives Will Help Us Both

My Decision

Let’s start by looking at my reasons for wanting to do this:

  • Become a published author
  • Improve my writing skills
  • Reach a new audience
  • Have some fun

I think these are good reasons to do it, but they are just that, reasons. To convert them to measurable objectives, I need to challenge them as much as your boss (not that Springsteen guy) would challenge any of your marketing program objectives with some of those “what do you mean by that?” type of questions. More on that later.

By quantifying the outcomes I’d like for each reason, we can begin to find the semblance of a measurable objective:

Become a published author: This is the easiest one. If the book is published and my chapter makes the cut, then mission accomplished. I have to admit, this is my number one objective, and the one I’d weight highest on my scorecard.

Improve my writing skills: Now it gets tougher. How do I measure the change in my writing skills from before until after I write that chapter? I could assemble a panel of writing experts and have them develop a scoring methodology to evaluate my before writing, perhaps a few of my newsletters. They would then have to use the same methodology to evaluate my completed chapter. The difference between the two scores would be my improvement. I could set my objective at a 10% improvement.

Reach a new audience: I need to start by being more specific about who I’m trying to reach. If I want to reach Springsteen fanatics to draw traffic to my dormant blog, my objective could be to increase average weekly unique site visitors by 20%.

If I want my chapter about Bruce to attract prospective clients for Optiv8 Consulting, then I need to define how much new business I’d like to acquire this way. I’ll set the bar for number of clients at one, which is likely overly optimistic. The dollar value objective for that one engagement will remain a confidential matter between my new Springsteen-loving marketer friend and myself. I’ve met many Springsteen-loving marketers over the years so, who knows, this might work!

Have some fun: This one is tough. I’ll know if I’m having fun when I’m doing it, but what could I possibly use as a Key Performance Indicator for my fun? I’m open to any suggestions you’d like to make but I know one thing. I’ll be wearing a massive grin the day my copy of that book arrives and I see my name in the book.

Your Decisions

Since I don’t know which program(s) you’re contemplating running, or what your objectives might be, I’ll suggest a few things for you to consider.

Start by asking if your objectives are just reasons without numbers. If you haven’t done the harder work of quantifying the results you want related to those reasons, you’ve yet to set objectives, and you won’t be able to measure properly when the program is over.

For each objective you set, challenge yourself with a few questions, before your boss hits you with those “What do you mean by that?” questions. These will get you started:

Who are you targeting? Examples: Current customers, prospects, specific market segments, a specific audience.

What do you want them to do? Examples: Follow/like you, subscribe, download, buy or buy more of specific products or services.

When do you want them to do it? Specify a period or a deadline.

How much of that do you need them to do for you to be happy? Pick a number or a percentage growth vs. a benchmark, like same period last year, and don’t sandbag it or your boss will challenge you some more!

The first three of the above questions help you to define the behaviour you want. In the last one, you quantify that behaviour.

In addition to making it possible to measure your marketing, setting proper objectives also sets expectations and defines success. That makes it easier to decide whether to allocate limited resources to a given initiative.

In truth, my decision isn’t too hard and I’ll probably go for it, assuming I can come up with an angle for my chapter. So my consulting work won’t suffer, I’ll re-allocate non-work time that I’ve allocated to other fun things, like to paint my front porch.

As a business executive or owner of a marketing budget, you must optimize your resources and budget by making good choices about which programs to fund. You’ll have your reasons for wanting to support each program, but be sure to challenge your reasons and objectives with some good questions before The Boss beats you to it.

For you Springsteen lovers, the blog is Your Friday Bruce Fix. I couldn’t tell you sooner as I worried you might never come back!

Big Data, Small Data


Introduction

Marketing measurement is a big problem, but the solution to the problem doesn’t also have to be big. In fact, it can be small.

This month’s post is about taking a small data approach to a big marketing problem.

_______________________________________________________________________________________


On Monday afternoon, I met my friend Reuben to get caught up over a coffee. I always enjoy our chats as they usually cover a wide range of interesting topics. Reuben also tends to ask great questions and make insightful comments. Monday was no exception.

While discussing how pervasive technology, analytics and big data are in marketing, we concluded that in contrast to all of that complexity and big data, I come at marketing measurement from a different angle; with something we might call a small data approach.

There is an emerging definition of small data as the few key pieces of meaningful, actionable information that we can uncover by analyzing big data. Those insights you extract from your big data become the last steps along the way to making better marketing decisions.

Actually, neither one of us had that definition of small data in mind during our discussion. Rather, we spoke of my “small data” approach to marketing measurement as small relative to other approaches and to the complexity of the problem.

My approach does align with the above definition of small data in the sense that I am very focused on organizing the chaos of all that data, uncovering insights and helping marketers to learn what they need to know so they can make better decisions. That is the reason to measure marketing and it needs to be the focus of any approach to measuring marketing.

Where my scorecard-based approach might also seem a bit contrarian is in its emphasis on measuring results vs. objectives and in not trying to calculate a financial return on investment (ROI). Although it would be ideal to accurately measure the financial ROI of marketing programs, as I have written about in the past, I think there are too many problems with doing financial ROI calculations for individual marketing programs.

I’ve always thought of my approach as a practical approach to a complex problem. As of Monday afternoon, I’m also starting to think about it as a small data approach to a big data problem. To explain what I mean by a small data approach, let me start with some thoughts on big data.

Big Data

Big data flows out of a set of circumstances that will tend to occur at bigger companies, and might include some combination of the following:

  • Big marketing budgets
  • Many marketing programs
  • Many products and/or services
  • Many communications channels
  • Many and diverse customers and customer segments
  • Many touch points on the customer path-to-purchase
  • Many transactions

These circumstances lead to a whole lot of data to analyze and understand which in turn leads to big data measurement solutions that will also tend to be big, complex, sophisticated and expensive.

With all the buzz around big data, it is easy for small and mid-sized companies to conclude that a high-science, big data solution must be the only legitimate way to approach marketing measurement. For many of these companies, a big, costly sophisticated approach isn’t needed or practical under their circumstances. A smaller, more practical approach can do the trick.

Small Data

Most small to mid-sized companies don’t operate under the same set of circumstances. Their budgets aren’t as big, their marketing activity is much less involved, their world is much less complex and they generate and collect a smaller amount of data. They also have fewer resources with which to take on the problem that all marketers must solve, which is to determine the best ways to invest their budgets.

A small data approach can be a great fit under these smaller circumstances. Yet, given the range of company size and marketing activity within the small to medium sized businesses segment, a one-size-fits-all approach doesn’t work. Any approach needs to have some built in flexibility so you can scale up or down to be appropriate for the size of the marketing budget being measured.

That’s really where I stand on marketing measurement. Right size your approach to your circumstances, and don’t overspend on measurement by bringing an over-sized solution to your problem.

Don’t over allocate resources to measuring something that you can’t measure perfectly, as the law of diminishing marginal returns will ensure you waste some of those precious resources. This is not about measuring perfectly; it’s about perfecting your marketing.

_______________________________________________________________________________________

About the Author: Rick Shea is President of Optiv8 Consulting, a marketing effectiveness consultancy with a focus on helping small to mid-sized organizations measure their marketing so they can stop wasting money.

Copyright ©2014 Optiv8 Consulting.  All rights reserved.

You may reproduce this article by including this copyright and, if reproducing electronically, including a link to:  http://www.optiv8.com/

Christmas Giving

I used to think that Christmas was all about the gifts, especially the receiving of gifts. As a kid, I remember the excitement of flipping through the Eaton’s and Sears catalogues and telling my parents which gifts I wanted Santa to bring me. My Christmas spirit was all about what was in it for me!

Of course, as I grew older my focus on gifts gradually shifted from receiving to the thrill of giving great gifts. Seeking out those great gifts became a big part of my getting into the Christmas spirit.

For a number of years, my siblings and I shared a fun tradition of going to our local mall on the afternoon of December 24th to pick up last minute gifts and stocking stuffers. Part of the fun was seeing who we’d bump into at the mall, like my high school gym teacher, Mr. Martin. I didn’t have the wisdom to ask him but I suspect he was there every year to see who he could bump into. Maybe that was one of his Christmas traditions and a way for him to get into the spirit.

With time, I’ve come to realize that much of my Christmas spirit comes from the traditions I’ve shared with my family. For example, we have many eating traditions; tourtière and French onion soup for Christmas Eve dinner, croissants on Christmas morning, the big turkey dinner, and of course a vast selection of desserts suitable for any meal or between meals!

A fun tradition emerged quite by accident one year when my mom gave each of us four kids a flexible, pliable little Santa Claus. We quickly realized we could entertain ourselves and each other by bending and twisting Santa into a new position, and then giving him a new name. I’m not quite sure how it started but it’s likely that my brother Jim had something to do with it. Here are a few favourites:

You get the idea. The possibilities are endless. This year, I have decided to print Christmas cards for my three nephews featuring these and other versions of Santa in the hopes it might inspire them to develop some silly traditions of their own.

I still enjoy giving gifts and in that spirit, I’ve got one for you. All you have to do is ask for it.

As a reader of this newsletter, you are probably aware that I advocate using a scorecard to measure your marketing effectiveness. I’ve developed a new version of my scorecard and I’d like to know what you think of it.

I’d like to give you a generic template of my scorecard so that you can customize and use it in your business to measure your marketing. I’ll also include an example to help you understand how to use it. I’ll send it to you as an Excel file so it will be easy to work with.

The scorecard is not designed to be a stand-alone product but rather part of a larger measurement process, so you may need a little help to get started. I’d be happy to provide some guidance by phone or whatever method makes sense.

In exchange, I’ll ask you for some feedback to see if I’m on track with this new version of the scorecard. In general, here are the kinds of things I’ll want to learn about:

  • How was the overall experience of working with this scorecard?
  • How do you feel using the scorecard has helped or could help to improve your marketing effectiveness?
  • Is this approach to measuring marketing suitable for your business?
  • How could the scorecard be improved?
  • What would stop you from using it?

I’m open minded about where our follow up discussion might go and what we might each learn in the process. I think that we should both benefit from this and that we might learn something unexpected.

If you’d like to receive your Optiv8 Christmas gift, email me at rick@optiv8.com and I will send you the scorecard. Please make sure to include your contact information so I can follow up with you in the new year.

I look forward to hearing from you. In the meantime, I’ll be making Christmas cards for my nephews!

Inputs & Outputs

One of the challenges in writing a monthly newsletter is writer’s block. It generally hits me in one of two ways. Either I have no idea what to write about, or I have an idea, but no story or setting for the idea.

I have two approaches to deal with writer’s block. I find that going for a walk in nearby Monarch Park is a great way to clear my head and then somehow the ideas come to me. Finding a story or a setting for my idea can be harder. Something has to happen so I can connect the idea to a story. Usually, I need to read something or get out and do something. Through interacting with a new person or situation, a story sometimes emerges.

Monday evening, faced with neither an idea nor a story for this newsletter, I ventured out to a McGill Alumni event at the Carlu where I could mingle and meet people. Among those I met were two relatively recent graduates (relative to me, that is) with whom I had a very enjoyable, wide ranging conversation. Unfortunately, nothing in our conversation triggered an idea or a story for this month’s newsletter, although I was happy to learn about “The Undercover Economist” Tim Harford, whose writing I’m already enjoying.

On my way home, I thought about other people I’d met lately and then the idea came to me. I realized how a discussion a couple of weeks ago with a highly skilled and experienced market researcher related to how marketing scorecards are an effective way to organize diverse types of data.

We discussed how the various things that can be measured about marketing are either inputs, the things that influence the desired customer behaviour, or outputs, the results of that customer behaviour. This concept can be very helpful in determining how to organize the marketing metrics on your scorecard, and in deciding how to weight them within your overall scoring system. Let’s look at some examples.

Marketing Input Metrics

First of all, there are two broad categories of inputs; those you control and those you don’t. Inputs under your control are generally related to how well you execute the program you are measuring. Examples could include:

  • The percentage of the in-store displays or signs you printed and distributed that were actually and properly put up in store
  • The percentage of all the promotional labels or neck tags your merchandizing partner actually affixed to your products
  • The number of and cost per impression of all your on and off-line marketing communications related to this program

Inputs outside of your control that might impact the success of your program could include:

  • Competitive activity – they dropped or increased their price, promoted heavily while your program was in market, had a PR disaster on Twitter, etc.
  • Weather – no one showed up at your well promoted event because of a massive snow storm

Marketing Output Metrics

There are also two types of outputs, but they are defined a little differently. The first are those outputs or results that are directly attributable to your marketing program. Examples might include:

  • Number of unique visitors to a landing page on your website built for this program
  • Click through rate from your landing page to the buying page
  • Number of new customers who bought using your promotion codes

The other type of outputs are those that are potentially but not definitely or entirely attributable to your program.  These are typically key business performance metrics that can be influenced by a variety of inputs. Examples might include:

  • Revenue for the brand being promoted
  • Market share of that brand
  • Average price per unit sold during the program

Grouping your metrics in this logical fashion on your scorecard can make it easier for you to select your metrics and make decisions about how to weight them by group. Inputs directly under your control and outputs directly attributable to your program should be more heavily weighted than outputs potentially attributable to your program. This is especially true if you tend to have a lot of programs in the market simultaneously. Whatever weightings you use, be consistent over time to ensure you can meaningfully compare programs to each other.

Exclude those inputs outside of your control from your overall calculations. It would be very hard to set objectives and to score against those objectives, or to know how much of an impact they really had. We know that a blizzard of the century will keep more people home than a light dusting of snow, but the amount of snow that makes people decided to stay home is different for everyone. Still, note whether you think external factors significantly impacted your results.

As I wrote this, I realized my opening story does connect to the idea for this newsletter, after all. My story was about an input, an activity under my control, in this case networking and meeting people. That created an output that was at least partially attributable to my networking efforts. I may have still come up with the idea without going to the Carlu, but I might not have found my story!


What Problem do you Want to Solve?

Earlier this week, I did a little light reading on big data. I’ve been hearing a lot about big data lately so I thought I’d investigate.

Truthfully, reading about big data is hardly light reading. Big data presents a big challenge and is emerging as a hot topic in marketing and general business management circles.

What is big data? Well, it’s not about presenting numbers in larger fonts to make it easier for people over 40 years old to read, although I’d probably appreciate something like that. Big data relates to the fact that businesses (and not-for-profits, and governments, etc.) operate in a data rich environment featuring increasingly voluminous, complex and diverse data.

For many organizations, there is more data coming at them than they can handle. The data is evolving rapidly and outgrowing their ability to analyze and glean the insights they need from the data to make better business decisions.

I liked the closing section in this article from which I’ll paraphrase advice from Christer Johnson, IBM’s head of advanced analytics in North America. To get started in tackling big data, first decide what problem you want to solve. That’s great advice in many aspects in life, including big data and it certainly applies to marketing measurement.

I’m reminded of the oft-quoted John Wannamaker, a pioneer of the department store concept in Philadelphia in the 1860s, who famously said:

“I know that half of the money I spend on advertising is wasted; the trouble is I don’t know which half.”

I think of John Wannamaker as one of the founders of the discipline of marketing measurement, as he may have been the first one to define the problem. I’m not convinced he ever solved the problem, but at least he knew what he needed to know. Here’s my take on the problem he was trying to solve.

For context, John’s quote comes from a time with a much less complex marketing environment, before there were any broadcast, internet or mobile media. John’s choice of advertising tactics was probably limited to a few simple options such as:

  • newspaper ads
  • flyers handed out to passers by
  • outdoor signs
  • a guy with a sandwich board on the sidewalk in front of the store
  • a boy cycling around the store, yelling out this week’s specials (a very primitive form of Tweeting)

Yet, in that simple world, John Wanamaker didn’t know which half was wasted. If John were alive today, he’d probably admit that he didn’t even know if it was half, or one quarter or two thirds that was wasted. All he really knew was that some forms of his advertising were more effective than others, and he wanted to know which they were.

With all due respect to John Wannamaker, I’d like to restate his well-known quotation as:

“I know that some of my advertising programs are more effective than others; the trouble is I don’t know which ones. Mostly, I just want to know the best way to spend my money.”

We can modernize this problem statement by substituting the word “advertising” with “marketing” and then it can serve as a starting point for most companies’ marketing measurement efforts. Like John, all managers with a marketing budget need to determine how to optimize that budget to meet or exceed their business objectives.

In these more complex times, with many more marketing tactics to choose from, there is also a lot more data to analyze and understand. Each program may target different customers, using different tactics with different objectives and performance metrics. Gathering the data for those metrics can involve a variety of sources, analytics tools and research techniques.

All that diverse data, big or otherwise, can certainly be a big mess if you don’t have a way to organize and analyze it. The analysis needs to happen in a way that enables comparing each program’s outcomes to the others, so you can identify the best ways to spend your marketing budgets.

A well-designed marketing scorecard can solve this problem. The key is to design your scorecard in a way that makes comparisons between diverse programs meaningful, and helps you to solve the same problem John Wannamaker was trying to solve all those years ago, to find the most effective ways to spend his money.


Measure Well, Sleep Well

If you know me or have been reading this newsletter for any length of time, you may know that photography is my favourite pastime. What you may not know is that organizations sometimes bring me in to take photos of their events, which is how I found myself at the AllerGen 2012 Annual Research Conference.

AllerGen is a not-for-profit organization whose role is to mobilize Canadian science to reduce the illness, mortality and socio-economic costs of allergic disease. The conference showcased the latest research in this regard and while often over my head scientifically (not hard to do), I found it quite interesting.

During an afternoon break at the conference, a distinguished looking gentleman named Douglas Barber approached me to talk photography. Our pleasant conversation eventually shifted to the conference and he told me a story that I quickly realized fit my thinking on marketing measurement.

Douglas explained he is on AllerGen’s board and that an issue of concern to him is the cost to the Canadian economy from the “asthma drag” on productivity. He explained how asthmatics can be less productive at work or even miss entire days of work following sleepless nights caused by asthma. Parents of asthmatic children can also experience the same productivity losses. Douglas also told me how he once did a quick “back of the envelope” calculation to estimate that asthma costs our economy between $10 and $20 billion per year in lost productivity.

Sometime after Douglas did his quick calculation, a full study was done to properly analyze and estimate the economic impact of asthma’s drag on productivity. The study concluded the annual costs are $15 billion. That’s right; a costly and complex measurement process produced the same answer as one expert using a pen and the back of an envelope.

Two aspects of this story relate to my views on marketing measurement:

  • Douglas’s back of the envelope calculation relative to the full study is similar to how a marketing scorecard can be a proxy for a sophisticated and costly marketing measurement process. In both cases, the less sophisticated approach doesn’t need to be perfect, just accurate enough to support analyzing options and making the right decisions. As I like to say, it’s not about precision, it’s about the decision.
  • The back-of-the-envelope estimate worked because it was done by an expert using a sound methodology. Douglas has an extensive business background and apparently knows more than just a little about productivity and related calculations. Scorecards are a proven methodology that you can enhance with expertise about your marketing and your business.

There is another lesson in Douglas’ story, and that’s the need to right size your measurement efforts to the magnitude of the decisions you need to make.

Research Investment Decision

  • Douglas’ back of the envelope calculation and the full-blown study produced essentially the same estimate and both pointed toward making the same decision. It’s a pretty compelling proposition if investing perhaps a few hundred million dollars into research would lead to recovering even just 10%, or $1.5 billion of the lost productivity, especially as that benefit would be realized every year.
  • The problem is that any decision to potentially invest a few hundred million dollars needs to be substantiated by more than a back of the envelope calculation. In this case, the cost of the research needed and the probability of recapturing that 10% are two other variables that I think would need to be estimated. It’s understandable that a full-blown study was needed to examine the overall business case.

Marketing Investment Decision

  • Similarly, for companies that invest tens of millions annually in marketing, it makes sense to support the decisions that need to be made with sophisticated marketing measurement efforts that might cost hundreds of thousands, or more.
  • For most companies with smaller marketing budgets, a practical lower cost approach such as one using a scorecard may well be the right sized measurement solution. In most cases, the overall measurement expense likely needs to be a small single digit percentage of the total marketing budget.

I like simple and elegant solutions that deliver what you need. A marketing scorecard’s simplicity keeps measurement costs down, while its elegance allows the flexibility to include a suitable level of expertise and sophistication to right size your measurement efforts to your marketing budgets.

Whichever measurement approach you choose, be sure to combine a sound methodology with the right expertise to learn what you need to know to make the right decisions. Measuring well will help you to sleep well and be a productive marketer!

Sabermetrics & Moneyball

While browsing the Sports section of the Toronto Star over breakfast one morning last week, I discovered a baseball statistic I had never heard of before.

Cathal Kelly’s article about the Toronto Blue Jays focused on General Manager Alex Anthopoulus’ fine work in transforming the Jays into a ballclub with great young players and a bright future. In Kelly’s analysis, he also pointed out that the Blue Jays “already have the best player in baseball”, José Bautista, who “leads all of baseball in wins above replacement rankings.”

I’ve followed baseball since I was a kid, but this was the first time I’d heard of “Wins Above Replacement”. Since José Bautista is considered one of the best players in baseball, I guessed it was some sort of composite score that rates a player’s overall performance. Still, I wondered “What the hell is Wins Above Replacement?”

In doing my research, I read up on Sabermetrics, an approach to statistical analysis in baseball that emerged in the 1990s. I read about Billy Beane, the General Manager of the Oakland A’s, who is a leading proponent of using statistical analysis to aid in making decisions about which players to draft, trade or acquire. Billy’s work in this area led to a book being written about him called ‘Moneyball”. I also learned that many teams now employ statistical analysts and Sabermetrics experts.

Sure enough, Wins Above Replacement turns out to be a Sabermetrics statistic that estimates how many more wins a player would give his team as compared to a replacement player of below average quality. While there appear to be a number of formulae used by different Sabermetrics proponents, the principles they follow align nicely with my scorecard approach to measuring marketing programs.

Any Wins Above Replacement formula takes into account a number of batting and fielding performance metrics, weights those metrics appropriately, and tallies everything up to provide one overall score to assess a player’s contribution to team wins. Similarly, a marketing scorecard uses a combination of company, brand, customer and program performance metrics, weighted appropriately, resulting in one overall score to asses a program’s impact on the business.

They both:

  • Have a limited budget (for players or marketing programs).
  • Need to get the most for their money (spending efficiency and effectiveness).
  • Need to get better results than their competitors (win games, make money).
  • Need a way to organize and make sense out of lots of diverse data about the performance of their players/programs and team/company (so they can improve their player/marketing decisions).

This last point is the most important one. A general manager trying to assess the performance of different players on different teams, playing in different ball parks under different conditions, needs a way to organize and then convert all that data into one metric or score that enables rating and ranking players relative to their peers. Wins Above Replacement does that. It may be calculated in different ways by different teams, but so long as each team does its own calculations consistently between players and over time, their comparisons will be meaningful.

The same is true with measuring marketing programs. As a manager with a marketing budget, you need to evaluate the performance of different programs, with different objectives, for different brands competing under different conditions. A well designed marketing scorecard will give you a way to organize, evaluate and convert that diverse data into the single common metric you need to rate and rank each program relative to the others.

Pretend that you’re the Billy Beane of marketing and you need a decision support tool that helps you to organize and make sense of diverse data about a variety of marketing programs. With a scorecard based approach and your considerable wisdom, instincts and experience, you’ll gain the insights you need to improve your marketing effectiveness!

From My Perspective

I like walking. Many mornings, my walk takes me to nearby Monarch Park. Over the last few years, I’ve frequently taken my camera to the park as part of a photographic self-improvement exercise which involves photographing the same subjects over and over.

Going back to the same park repeatedly forces me to develop my ability to see and capture photos of the same subjects in new and creative ways. I’ve learned there isn’t one right way to capture any one subject, and there are usually many fine ways to capture the same subject.

Here’s what I’ve observed about the two main variables I have to work with; light and composition.

  • The light in the park can look very different in different seasons, at different times of day and in different weather.
  • As for composition, I see the best new photos when I change my perspective by changing where I’m walking or standing.

A recent foggy morning created new circumstances. The same old views looked very different due to the soft light and the masking effect of the fog.  In search of a new composition, I changed my perspective by leaving my usual route and walking through a more wooded area. Through the combination of the fog and a different perspective, I quickly saw something I had never seen, which led to my capturing one of my favourite images of the park.

When I first developed my approach to measuring marketing, my perspective at the time was that I was trying to solve the following problem. I was trying to help marketers answer questions like “Did that marketing program work?” or “Did I use my money wisely on that program?”. From that perspective, I designed a scorecard to measure individual marketing programs.

I started using that approach but quickly realized that my perspective on marketers’ problem needed to shift slightly.

  • Instead of asking “Did that marketing program work?” marketers wanted to know “Which of my programs worked best?”.
  • Instead of asking “Did I use my money wisely on that program?” they wanted to know “What are the best ways for me to use my money?”.

The differences between the original and the revised question in each pair are small in words but large in meaning. Answering the original questions can provide some insights about individual programs, whereas answering the second questions goes well beyond those insights.

With my slight perspective shift came more clarity about the problem marketers need solved. I developed a more robust scorecard, using a methodology that could be applied consistently across all programs. That change enables marketers to compare programs to each other so they can see which programs are most and least effective, and then adjust their marketing strategies and improve business results.

Just as importantly, I created an effective process for identifying and ensuring the right things would be measured on that scorecard.

Light and composition are the two main variables that impact taking photos, while a marketing measurement system’s two main variables are the design of the scorecard and the choice of metrics to put on the scorecard. In both cases, there isn’t one right or perfect approach, and many will provide worthwhile results if you get the fundamentals right and focus on solving the right problem.

  • The Right Problem to Solve: The reason to measure your marketing is to optimize your marketing decisions and improve your business results.
  • Scorecard Design Fundamentals: It needs to be flexible enough to measure any kind of marketing program, while also consistently using a standardized methodology that makes it meaningful to compare each program to all the others.
  • Choice of Metrics Fundamentals: Understand how your company creates value, who your ideal customers are and how you define profitable customer behaviour. Your marketing should target those customers and that behaviour, and the metrics you chose should help you to see whether marketing is helping to create value for your business.

Measurement is an integral part of continuously improving your marketing effectiveness. With a steady effort, an occasional shift in perspective and an eye on the fundamentals, your measurement will evolve and improve over time, as will your marketing.  In the meantime, I’m here if you need my help, unless I happen to be out in the park changing my perspective.