Emissions Test

My car is getting old. Like me, it doesn’t always feel its age, but the reality is that by most measures it is getting old. One measure of its advancing age is that in order to renew my vehicle licence recently, my car first had to pass an emissions test.

In Ontario, when the Ministry of Transportation sends you your vehicle licence renewal application, they indicate if your car needs to be emissions tested.  This time around, my middle aged car was due for a test.

The Ministry requires the test be performed at one of the accredited Drive Clean facilities listed on their website.  I found a local facility and within 15 minutes of arriving, I drove out of there with the clean bill of health for my car that I would need to renew my vehicle licence.

While waiting for my car to be tested, I entertained myself by reading the wall poster and brochure that described the emissions testing procedure. As a guy who cares about good measurement practices, I was impressed by two things:

  1. The Ministry has a consistent and transparent measurement process.
  2. Their process includes a clear and simple scoring system.

Let’s look at how each of these illustrate what a good marketing measurement system needs to do.

Measurement Process

These are the steps that all Drive Clean facilities follow when testing a car:

  1. Perform visual inspection
  2. Drive car onto Dynamometer
  3. Insert probe into tailpipe
  4. Accelerate vehicle to 40 km/hr
  5. Computer analyses emissions and compares to standards for make, model and year
  6. Print test results
  7. If Pass, owner can renew vehicle licence
  8. If Fail, owner must repair car at a Drive Clean Repair facility, then re-test

Here’s what I like about this process, especially as the same things are true of a good marketing measurement process:

  • Its clear steps can be repeated consistently, making the results meaningful and comparable to other results, standards and benchmarks.
  • The process is well supported by documented procedures, such as the 20 page “Drive Clean Guide” that I found on line. The guide is amended and reissued periodically, as needed.  Well documented and updated procedures ensure consistency in measurement and clarify who is responsible for doing what and when.
  • The standards that define passing and failing results are clearly documented.

Scoring System

The scoring system is quite simple.  There are a few metrics for which your car must obtain a passing score.  For example, on Hydrocarbons, as measured in Parts Per Million, my car needed to be at 66 or less in order to pass. Fortunately, my reading was 3 and thus my result on this metric was a “Pass”. (I lobbied for extra points for such a low score, but to no avail!)

The key elements of this simple scoring system that relate to marketing measurement are:

  • Metric: Define the metric (Example – Revenue) and the unit of measurement (Example – for Total Company, for Specific brand, per square foot, per average transaction, etc.).
  • Objective: Define the target result, or limit, or range of acceptable results. (Example – Average revenue per transaction of $50 for Brand X in 1st Quarter of 2012).
  • Result: The actual outcome for the metric and objective as defined.
  • Scoring: You need to score how good the result is as compared to the objective. Will you use a pass/fail, a 10 or 5 point scale, a score out of 100, or some other scale?  Whichever you pick, be sure you can apply it consistently and fairly.

Summary

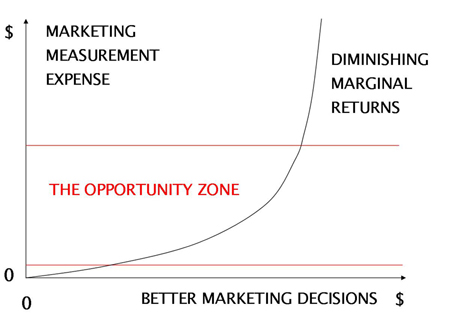
A properly documented measurement process will provide the consistency needed to make comparisons between programs meaningful.  A clear scoring system gives you a way to convert all your results to a common metric, which also enables comparing programs to each other.  These two essential components of a reliable marketing measurement system support making well informed strategic marketing  decisions, which comes down to making choices between programs, refining your strategies and finding the most effective ways to market your products and services.

Pictures at an Exhibition

I’m a long time hobbyist photographer. While I occasionally get hired to take photos for commercial use (e.g. events, product shots, architecture), I mostly just do it for fun. In fact, I had never formally exhibited my photos prior to this past weekend when I participated in an art show on my street.

Now in its fourth year, this show is basically an art walk limited to the one block of the street on which I live. I was one of 10 artists exhibiting a variety of art in 5 houses, on both Saturday and Sunday afternoons.

Reflecting on the event Sunday night I decided that it was a lot of fun, I’m really glad I exhibited and I’ll probably do it again next year. Since that simple statement doesn’t make for much of a newsletter on marketing measurement, I thought I would elaborate on how I came to that conclusion.

What I Spent

To begin with, my cost to participate was very low. Since the walls in my house were already covered with plenty of framed photos and ready to exhibit, I just needed to shuffle a few around and decide on prices. I probably spent all of about $50 to get ready, including salty snacks and chocolate chip cookies for my visitors. So, my costs were minimal.

What I Sold

I sold a total of 7 photos for $525. I’m happy with this outcome because:

  • Over the 2 days, I estimate 45 people dropped by my house. One person bought 2 photos, meaning I converted 45 prospects to 6 customers, for a conversion rate of 13.3%. This seems like a good rate for an art show, but I don’t have a benchmark to compare it to.
  • My sales surpassed my expectations. I thought I would do well to sell two or three photos and maybe pocket $200.
  • My customer acquisition cost ($50 ÷ 6 = $8.33 per customer) was much lower than my average revenue per customer ($525 ÷ 6 = $87.50 per customer) making each transaction and the overall event profitable.

What I Learned

For some background, our marketing efforts consisted primarily of:

  • Post card invitations hand-delivered to homes within roughly a 2 block radius
  • Each artist emailed invitations to their own list of contacts
  • The organizers solicited and obtained support from local politicians who emailed local residents and tweeted our event
  • Free on-line publicity, most of which came through a new local website called GrownUps55plus, for which I’m saying thanks by this mention

Secretly wearing my marketing measurement hat while disguised as an artist, I randomly asked those visitors I didn’t know the usual “how did you hear about us” kind of questions.  I learned that, in addition to those friends and neighbours I already knew, most people either:

  • Lived in the neighbourhood, or
  • Were friends of one of the other artists

From a product point of view, of the seven photos I sold, 4 featured trees as the main subject, 1 featured a tree and a window, 1 featured a window, and the other featured a racoon. Selling the racoon photo gave me a chuckle because earlier that day two other people had separately A) cursed the racoon, and B) saluted it with a middle finger. Clearly, one person’s art is another’s neighbourhood menace. Also, people like trees.

Another interesting fact is that the turnout was much higher last year when some houses estimated traffic at 300+ visitors. Perhaps that’s a sign people are less confident in the economy this year? Imagine if I could have applied my 13.3% conversion rate to 300 people instead of 45!

What I Would Do Differently Next Time

Based on my informal measurement efforts and observations, and input from the other artists, here are some thoughts for us to consider for next year:

  • Proximity and familiarity seem to bring people out, so we should expand our post card coverage beyond 2 blocks and each artist could invite more people.
  • Recruit more houses and artists to participate; the additional artists can invite their contacts, and a larger event with more art for sale should appeal to more people.
  • Continue to solicit free publicity and politician support.
  • Find a volunteer with public relations expertise, perhaps a student looking for experience, to help us get more local and on-line media coverage.

Conclusion

I didn’t apply measurement to our marketing efforts in any sort of disciplined way, yet maybe that’s appropriate for such a low budget event. Still, by simply looking at what I spent, what I sold, what I learned and what I would do differently next time, I should be able to improve my sales next year, and that’s what counts.

Whether for a small event like this, or a major marketing initiative, the best way to improve next time is to make sure you have a way of learning from what you did this time. Measure, review, reflect and capture what you’ve learned, so you can optimize future strategies.

There’s other soft data to consider, too. I had a great time, met some neighbours, saw some friends and enjoyed seeing people enjoying my photos.  I look forward to next year and in the meantime, I’ll be out shooting windows and trees, or maybe even a racoon.


Separating Fact from Opinion

Megan Kalmoe rowed for the United States at the Beijing Olympics and is a 2011 World Silver Medalist. While she’s obviously a great rower, I hadn’t heard of Megan before reading Randy Starkman’s article in the Sports section of the Toronto Star on October 13, 2011.

The story focused on the fact that Megan named two Canadian men to the 2011 edition of her “20 Hottest Male Rowers” list, which she recently published on her blog. Not surprisingly, I didn’t make the list. One reason is that I’ve never rowed in my life. There might be other reasons, perhaps many, but more on that later.

I’m happy when Canadians do well in any international ranking, but being a marketing measurement guy, my interest in this article was to learn about Megan’s rating and ranking process.

Here’s what I learned:

  • You must be a world class male rower
  • You may lobby Megan to get on her list
  • Megan’s female friends can nominate you and lobby on your behalf
  • If Megan thinks you’re hot, she might add you to the list

As far as I can tell, Megan’s approach is pretty subjective and unstructured, and the resulting list reflects her opinion, which is fine.  I can’t tell whether lobbying influences Megan’s decisions, but it really doesn’t matter.

It is worth noting that Megan is just having fun with this and important strategic decisions aren’t being made because of her list. But, consider this. What would happen if the top three rowers on Megan’s list landed endorsement deals because they topped her list?

I think the fun and friendly lobbying might get a little more intense for the 2012 list, and Megan might feel the need for a more structured approach to minimize the impact of bias and personal opinion on the rankings.

For now, since this is all in good fun, Megan’s methodology for measuring male rower hotness is perfectly appropriate and as good an approach as any. However, when it comes to measuring marketing program hotness, marketers need a more rigorous approach.

What if you used a similarly unstructured method for measuring marketing programs? Brand managers would lobby you to have their programs highly rated. People working in sales, finance, customer service or operations would also offer their opinions. You wouldn’t have much fact-based data and you’d end up having to make an opinion-based judgment call.

The impact on your judgment call of everyone lobbying to influence your opinion might come down to:

  • The clout of each person doing the lobbying, perhaps related to their role in the organization
  • Each lobbyist’s communication skills and powers of persuasion
  • Your ability to separate fact from opinion, and to somehow remain objective

Here’s the problem. You don’t want the most effective lobbyists to skew the rankings in their favour.  Nor do you want personal opinion and bias tainting your overall approach. Opinions are interesting, but not very actionable.

To be able to take action, make good decisions and adjust strategies, you need data to identify your most and least effective programs. A structured and disciplined methodology will give you that data, while filtering out opinion.

To remove as much personal bias and opinion as possible from your marketing measurement efforts:

  • Involve the Right People: Create a cross-functional group to pick an approach that balances everyone’s needs and interests, so the approach is fair and equitable for all.
  • Involve Unbiased People: People with no vested interest in which programs get the highest rankings could include an analyst, someone from Accounting, or an independent consultant.
  • Set Clear Evaluation Criteria: Disclose how you will consistently evaluate each program, so everyone knows and plays by the rules.
  • Set Objectives Up Front: This prevents people from later setting lower objectives than they would have up front, thus making both their successes and failures look better.

Whether you need to identify your 20 hottest marketing programs, or which types of marketing spending should be increased or decreased, make sure your measurement methodology gives you the unbiased and opinion-free data and facts you need to make better decisions.

As for the fact I didn’t make Megan’s list, I think if I was at least 20 years younger, 10 pounds lighter, 5 times as athletic, a lot hotter and a world class rower, I could have been a contender. Of course, Megan might have had a different opinion!

Sabermetrics & Moneyball

While browsing the Sports section of the Toronto Star over breakfast one morning last week, I discovered a baseball statistic I had never heard of before.

Cathal Kelly’s article about the Toronto Blue Jays focused on General Manager Alex Anthopoulus’ fine work in transforming the Jays into a ballclub with great young players and a bright future. In Kelly’s analysis, he also pointed out that the Blue Jays “already have the best player in baseball”, José Bautista, who “leads all of baseball in wins above replacement rankings.”

I’ve followed baseball since I was a kid, but this was the first time I’d heard of “Wins Above Replacement”. Since José Bautista is considered one of the best players in baseball, I guessed it was some sort of composite score that rates a player’s overall performance. Still, I wondered “What the hell is Wins Above Replacement?”

In doing my research, I read up on Sabermetrics, an approach to statistical analysis in baseball that emerged in the 1990s. I read about Billy Beane, the General Manager of the Oakland A’s, who is a leading proponent of using statistical analysis to aid in making decisions about which players to draft, trade or acquire. Billy’s work in this area led to a book being written about him called ‘Moneyball”. I also learned that many teams now employ statistical analysts and Sabermetrics experts.

Sure enough, Wins Above Replacement turns out to be a Sabermetrics statistic that estimates how many more wins a player would give his team as compared to a replacement player of below average quality. While there appear to be a number of formulae used by different Sabermetrics proponents, the principles they follow align nicely with my scorecard approach to measuring marketing programs.

Any Wins Above Replacement formula takes into account a number of batting and fielding performance metrics, weights those metrics appropriately, and tallies everything up to provide one overall score to assess a player’s contribution to team wins. Similarly, a marketing scorecard uses a combination of company, brand, customer and program performance metrics, weighted appropriately, resulting in one overall score to asses a program’s impact on the business.

They both:

  • Have a limited budget (for players or marketing programs).
  • Need to get the most for their money (spending efficiency and effectiveness).
  • Need to get better results than their competitors (win games, make money).
  • Need a way to organize and make sense out of lots of diverse data about the performance of their players/programs and team/company (so they can improve their player/marketing decisions).

This last point is the most important one. A general manager trying to assess the performance of different players on different teams, playing in different ball parks under different conditions, needs a way to organize and then convert all that data into one metric or score that enables rating and ranking players relative to their peers. Wins Above Replacement does that. It may be calculated in different ways by different teams, but so long as each team does its own calculations consistently between players and over time, their comparisons will be meaningful.

The same is true with measuring marketing programs. As a manager with a marketing budget, you need to evaluate the performance of different programs, with different objectives, for different brands competing under different conditions. A well designed marketing scorecard will give you a way to organize, evaluate and convert that diverse data into the single common metric you need to rate and rank each program relative to the others.

Pretend that you’re the Billy Beane of marketing and you need a decision support tool that helps you to organize and make sense of diverse data about a variety of marketing programs. With a scorecard based approach and your considerable wisdom, instincts and experience, you’ll gain the insights you need to improve your marketing effectiveness!

From My Perspective

I like walking. Many mornings, my walk takes me to nearby Monarch Park. Over the last few years, I’ve frequently taken my camera to the park as part of a photographic self-improvement exercise which involves photographing the same subjects over and over.

Going back to the same park repeatedly forces me to develop my ability to see and capture photos of the same subjects in new and creative ways. I’ve learned there isn’t one right way to capture any one subject, and there are usually many fine ways to capture the same subject.

Here’s what I’ve observed about the two main variables I have to work with; light and composition.

  • The light in the park can look very different in different seasons, at different times of day and in different weather.
  • As for composition, I see the best new photos when I change my perspective by changing where I’m walking or standing.

A recent foggy morning created new circumstances. The same old views looked very different due to the soft light and the masking effect of the fog.  In search of a new composition, I changed my perspective by leaving my usual route and walking through a more wooded area. Through the combination of the fog and a different perspective, I quickly saw something I had never seen, which led to my capturing one of my favourite images of the park.

When I first developed my approach to measuring marketing, my perspective at the time was that I was trying to solve the following problem. I was trying to help marketers answer questions like “Did that marketing program work?” or “Did I use my money wisely on that program?”. From that perspective, I designed a scorecard to measure individual marketing programs.

I started using that approach but quickly realized that my perspective on marketers’ problem needed to shift slightly.

  • Instead of asking “Did that marketing program work?” marketers wanted to know “Which of my programs worked best?”.
  • Instead of asking “Did I use my money wisely on that program?” they wanted to know “What are the best ways for me to use my money?”.

The differences between the original and the revised question in each pair are small in words but large in meaning. Answering the original questions can provide some insights about individual programs, whereas answering the second questions goes well beyond those insights.

With my slight perspective shift came more clarity about the problem marketers need solved. I developed a more robust scorecard, using a methodology that could be applied consistently across all programs. That change enables marketers to compare programs to each other so they can see which programs are most and least effective, and then adjust their marketing strategies and improve business results.

Just as importantly, I created an effective process for identifying and ensuring the right things would be measured on that scorecard.

Light and composition are the two main variables that impact taking photos, while a marketing measurement system’s two main variables are the design of the scorecard and the choice of metrics to put on the scorecard. In both cases, there isn’t one right or perfect approach, and many will provide worthwhile results if you get the fundamentals right and focus on solving the right problem.

  • The Right Problem to Solve: The reason to measure your marketing is to optimize your marketing decisions and improve your business results.
  • Scorecard Design Fundamentals: It needs to be flexible enough to measure any kind of marketing program, while also consistently using a standardized methodology that makes it meaningful to compare each program to all the others.
  • Choice of Metrics Fundamentals: Understand how your company creates value, who your ideal customers are and how you define profitable customer behaviour. Your marketing should target those customers and that behaviour, and the metrics you chose should help you to see whether marketing is helping to create value for your business.

Measurement is an integral part of continuously improving your marketing effectiveness. With a steady effort, an occasional shift in perspective and an eye on the fundamentals, your measurement will evolve and improve over time, as will your marketing.  In the meantime, I’m here if you need my help, unless I happen to be out in the park changing my perspective.


Opportunity Knocks!

Last Saturday at around 5pm I was frantically cleaning my house. I had cleaned the bathrooms, vacuumed, swept and dusted, and was about to wash the kitchen floor when it suddenly hit me. I was wasting my time.

Sensing an opportunity, I wisely settled into my favourite comfy chair, put my feet up and took a nap. This was a much better use of my time than washing the kitchen floor, especially considering the night ahead. Here’s why.

At roughly 8pm that night, the first of 50 or so of my friends would begin knocking on my front door to attend my annual spring party. I knew that many of the 50 would gather in the kitchen.  All those feet would be guaranteed to make for a dirty floor, which I would have to wash again after the party.

The additional benefit of washing that floor before the party would be negligible, at best. I’d feel good about my clean floor (which no one else would notice), but only until all those feet arrived (with friends attached) and began to mess it up. On the other hand, a nap would really boost my energy for the evening.

Excessive investments of time and energy into house cleaning prior to a party are adversely affected by the law of diminishing marginal returns. (Try quoting me if you need to get out of a cleaning chore sometime!) For each extra cleaning investment, you get less and less back in terms of the quality of the party or the guests’ enjoyment of it. While a house needs to be clean enough to be presentable, it doesn’t need to pass the white glove test.

Similarly, investments of time, money and people into marketing measurement are also impacted by diminishing marginal returns. You shouldn’t overspend on measurement and it doesn’t need to be perfect or pass the measurement equivalent of a white glove test. It just needs to be good enough to help you to make better decisions. Consider the following visual:


The vertical axis represents the resources you invest (money, time, people) to measure your marketing. The horizontal axis represents what you learn from those measurement investments that help you to make better marketing decisions, thus improving your marketing effectiveness.

The curve represents my view of the rate at which incremental measurement investments improve marketing decision quality. Generally, the more you invest in measurement, the better your marketing decisions get, but it’s not a straight linear relationship.

Let’s look at this curve in each of the three zones separated by the two red horizontal lines, starting from the bottom zone.

Bottom Zone

  • Characteristics: Starting at zero on both axes, as you begin to measure you very quickly learn things that can improve marketing decisions. Most organizations in this zone have very small marketing budgets, and few resources, so it may not be possible to invest much in measurement, nor are there many marketing decisions to improve.
  • Recommended Strategy: Take advantage of no or low cost measurement tools and internal data. Measure anything and you will likely learn something useful.

Middle Zone

  • Characteristics: Organizations in this “Opportunity Zone” have marketing budgets that are big enough to be worth measuring, and can allocate a small percentage of their budget to measurement. The opportunity in this zone is that small investments pay off quite nicely in the way of improved marketing decisions. The return from better decisions shows up as lower or more efficient marketing expense, and higher revenue and profit.
  • Recommended Strategy:  Consistently apply a disciplined and practical approach to learn what you need to know to improve decisions. Resist the temptation to over invest in the more sophisticated (and expensive) measurement solutions that will bring you closer to the steepening section of the curve where you get a lower return for your incremental investments.

Top Zone

  • Characteristics: Here we see the most severely diminished marginal returns from measurement investments. It takes significant additional investments to yield even the slightest improvements in decisions. Only the largest of organizations with enormous marketing budgets can play successfully in this zone, as small market share gains and sales lifts can be very profitable. Other characteristics of this zone will include a lot of complex data and sophisticated measurement techniques.
  • Recommended Strategy:  Question every bit of measurement spending. Just as there is great opportunity to learn at the lower end of the curve, on the upper end there is equally great opportunity to reduce measurement costs without significantly damaging decision quality.

That’s the way I see the relationship between measuring your marketing and how it helps you to get better results. There are exceptions to every rule, but the law of diminishing marginal returns is one of economics’ most powerful laws, so ignore it at your peril.

Have you identified which zone of the curve you’re in? There are a lot of organizations in the bottom and middle zones, who may not currently measure their marketing, or who aren’t happy with their efforts to do so. If that sounds like your organization, a great opportunity knocks at your door!

In the meantime, if you need me, I’ll be in the kitchen mopping the floor!

Social Media and Social Eating

Somewhere in the middle of a Dim Sum eating frenzy last Sunday at Rol San in Chinatown, my friend Elliot pointed out that five of our group of seven sitting around the table worked in marketing. Despite the fact that marketers can be creative and some in our group of seven are rather artistic, we’re nothing at all like Canada’s renowned Group of Seven painters. After our efforts last Sunday though, I’d say we are a group of seven skilled in the art of social eating.

Elliot’s comments came during a discussion about how a certain academic institution appeared to be measuring the success of a controversial event they had publicized through their website and social media.  In response to criticism of this event, they pointed to their number of subscribers, as if that somehow indicated a level of support for their controversial point of view.

Of course, just being a subscriber doesn’t automatically imply agreement with every point of view expressed. In this case, the number of subscribers was irrelevant. It would be more relevant to know the ratio of subscribers for vs. against the event taking place, and/or the point of view being presented.

Around the table we began discussing how to measure social media and quickly agreed that volume or Activity metrics aren’t as relevant as metrics that track customer Engagement. Even more important to track is a third group called Conversion metrics. To illustrate, let’s look at these three types of metrics in the context of measuring social media and also our customer experience at Rol San.

Activity Metrics

  • Social Media: Examples include number of subscribers, followers, followers/following ratio, tweets, fans, and links clicked. You can get a sense of what people are doing, but less about why or how they’re feeling.
  • Dim Sum Customer Experience: Examples include the total plates ordered, the average items eaten per person, and the average revenue per person. These metrics would tell Rol San how much we ate, but they wouldn’t know whether we were satisfied customers.

It is generally more relevant to look at:

Engagement Metrics

  • Social Media: Examples include forwards, mentions, likes, comments, retweets and the sentiment of comments, tweets and blog posts. These types of metrics can provide more insights into what your customers are thinking and feeling about your brands and marketing programs.
  • Dim Sum Customer Experience: Rol San might want to know if that second order we placed repeated any items from our first order. (It was hard to tell amidst the flurry of plates and chopsticks.) Did anyone tweet or blog about our meal, or post a review somewhere? Were the comments or reviews positive or negative? Are the people who posted comments influential with the right audience?

It can be hard to tell what customers think and whether they are truly satisfied. That’s why so many eating establishments include a customer satisfaction survey with your bill. Many of these direct you to a website to give your feedback, which can then be linked to your transaction (what you ordered, your server’s name, etc.) to help round out the customer experience picture.

Still, engagement metrics and customer satisfaction scores have their limits. What customers say can often be different from what they actually do. Attitudes and opinions can help to predict behaviour, but all that investors, shareholders and bankers really care about is profitable customer behaviour, and how that behaviour converts into value for the business.

Conversion Metrics

  • Social Media: The greatest Conversion metrics of all are revenue and profit. Other examples include qualified leads generated, content downloads, registrations, reservations and orders; basically anything that might track key steps in acquiring, keeping and cultivating profitable customers.
  • Dim Sum Customer Experience: Rol San should care about whether we come back as a group, or individually with more friends, and whether we recommend to others to dine there. In a retail business, these metrics can be hard to track, which is one of the reasons loyalty and viral marketing programs exist, to both incent and track profitable customer behaviour. It’s also why hosts or greeters sometimes ask “Is this your first time here?” or “How did you hear about us?”

I can’t speak for the others in our Group of Seven Social Eaters (G7SE?), but I think I will probably return to Rol San someday.  How’s that for mildly positive sentiment and uncertain repurchase intent? Rol San could invest a lot of money trying to predict my behaviour, but even I can’t predict what I’m going to do. They’d be better off tracking what I actually end up doing.

Conversion metrics are the most important metrics to track and they should be more heavily weighted on your scorecard. At the same time, don’t ignore Activity and Engagement metrics, as they are predictors of conversion. They can help you to identify where programs are succeeding and failing in creating the customer behaviour that leads to profits.

Why am I hungry?

Warren and Me

While reading my good friend Warren Buffett’s 2010 letter to his Berkshire Hathaway shareholders, I found myself smiling and nodding on several occasions. Before I explain, I should point out that Warren and I are not actually friends; I just said that so you’d keep reading. I suppose it would be fair to say that I know Warren a lot better than he knows me, which is not at all.

The reason I referred to Warren as a friend, aside from the attention grabbing value of doing so, is that when I read his various comments about how he measures his company’s performance, I saw many parallels to my own views on measuring marketing performance. In that sense, we are friends. Here are a few examples featuring excerpts from Warren’s well crafted letter.

Example 1

  • Warren: “I believe that those entrusted with handling the funds of others should establish performance goals at the onset of their stewardship. Lacking such standards, managements are tempted to shoot the arrow of performance and then paint the bull’s-eye around wherever it lands.”
  • Me: Those managing marketing budgets have the same responsibility. Set performance goals up front so everyone is clear on how marketing spending will be judged. Selecting goals after the fact introduces a bias towards using metrics that prove marketing worked rather than determining whether it worked.

Example 2

  • Warren: “Our job is to increase per-share intrinsic value at a rate greater than the increase (including dividends) of the S&P 500.” … “The challenge, of course, is the calculation of intrinsic value. Present that task to Charlie (Vice Chairman, Charlie Munger) and me separately, and you will get two different answers. Precision just isn’t possible.” … “To eliminate subjectivity, we therefore use an understated proxy for intrinsic value – book value – when measuring our performance.”
  • Me: Marketing’s duty is to run programs whose objectives align with those of the organization. Any business exists to make money but, I don’t try to measure the exact financial ROI of each program because I feel that type of precision just isn’t possible. My proxy for ROI is to measure program results against their objectives, which should be focused on driving profitable customer activity and creating value for the business.

Example 3

  • Warren: In writing about how he values Berkshire, Warren explains why he doesn’t use net income as a metric. “Regardless of how our business might be doing, Charlie and I could – quite legally – cause net income in any given period to be almost any number we would like.”
  • Me: Choose metrics that are reliable and meaningful, and above suspicion of being manipulated to tell the story you want to tell. You want the people that matter to trust that your numbers accurately reflect the truth, not your version of the truth.

Example 4

  • Warren: Berkshire uses a well accepted accounting standard (Black-Scholes) for valuing option contracts, a standard that Warren doesn’t seem to like because under certain circumstances it can produce “wildly inappropriate values”. On this, Warren writes “Part of the appeal of Black-Scholes to auditors and regulators is that it produces a precise number. Charlie and I can’t supply one of those.” … “Our inability to pinpoint a number doesn’t bother us: We would rather be approximately right than precisely wrong.”
  • Me: I love that last sentence! There is a natural inclination to want to measure marketing precisely but I don’t think a high level of precision is needed to make good decisions. If you can be approximately right at identifying which marketing programs were most and least effective at meeting their objectives and creating value for your business, then you can make very good decisions that will optimize your marketing effectiveness.

I was glad to read how Warren’s point of view aligns with my thinking on marketing measurement. Any good measurement process just needs to be right enough to be an effective decision support tool. We need to measure the right things well enough that we learn what we need to know to make better decisions.

Warren and I may not be friends, but he’s a guy that I’d love to sit down with, have a hamburger (he apparently loves hamburgers) and soak up any wisdom he’d like to share. Since that’s not likely to happen, I’ll have to make do with a pretty good letter from a wise man.

PS. If you’d like to read Warren’s full letter, you can find it at the Berkshire Hathaway website: http://www.berkshirehathaway.com/letters/2010ltr.pdf

Apples, Oranges and Bananas

A funny thing happened yesterday on my way to the refrigerator.  I was working from home.  It was mid-afternoon and time for my snack.

I rose from my desk, went downstairs and walked my appetite into the kitchen, but stopped short of opening the fridge door.  I paused, wondering what to eat.  With the Christmas eating marathon still fresh on my mind, and around my waist, I was looking for a healthy snack, likely a piece of fruit, but which one?

My choice of available fruit came down to an apple, an orange and a banana.  I considered my options.

  • Apples: Are high in pectin, a fibre which has a long list of health benefits, the flavonoids reduce diabetes risk, and they taste refreshing.
  • Oranges: The antioxidants offer protection from all sorts of disease, the vitamin C supports the immune system, and they taste great.
  • Bananas: The potassium lowers stroke risk, the vitamin B6 keeps the nervous system in top shape, and they are more filling than the other two.

Hmmm…  They’re all good, I thought, but in different ways.  While as fruit they have their similarities, they are each designed to meet different objectives.  How do I compare them?  How do I choose?

Naturally, as you might expect, my first big decision of 2011 reminded me of the problem marketers face when trying to decide which of a group of marketing programs was most effective.  Deciding which piece of fruit or marketing program was most effective depends heavily on my objectives related to eating, or on the marketer’s objectives related to each program.

One of the challenges in comparing Marketing Program (or fruit) A to B to C is that they each have different objectives.  That means, the right metrics to measure each program might be quite different from the metrics to measure the other programs.  This fact makes comparison very difficult. As they say; it’s like comparing apples to oranges.

To make this comparison easier, you need to focus on comparing how effective each marketing program is at doing whatever it is supposed to do. Let’s start with the last six words of that sentence.

Step 1:  Decide which metrics to use. Answer two simple questions about each program:

  • Who are you targeting?
  • What do you want them to do?

For example, consider the different metrics you might use to measure:

  • A public relations campaign to raise awareness among non-customers
  • An email program to incent loyalty and improve customer retention
  • An online contest to add email addresses to your customer database and incent referrals to non-customers

Step 2:  Level the playing field. This is the part where you compare the relative effectiveness of programs measured with different metrics:

  • Create a standard scorecard for your business. This becomes your template.  Your scorecard needs to have the flexibility to measure all types of marketing programs, and accommodate all types of metrics.  For a simple program you might need 5 to 10 metrics, whereas for a complex one you might need 30 to 40.
  • Customize your template to create a scorecard for each program. Some metrics will appear on each program’s scorecard, while others will vary from one scorecard to the next, given that the programs each had different objectives.
  • Score each metric according to how it performed vs. its objective.  (actual/objective X 100%) This is the pivotal step that converts all metrics into one common metric, in this case a percentage.  Working with a common metric enables scoring each one and totaling your scores for each scorecard.

That last step is critical to enabling you to compare programs with differing metrics.  Instead of figuratively looking at apples, oranges and bananas and trying to figure out which is better, now you’re just looking at fruit, with a simple comparable rating for each. Then rank them, and you’ll know which programs were best and worst at meeting their objectives and delivering the results you wanted.

To solve my little dilemma yesterday, I suppose I could have created a Fruit Measurement Scorecard, based on my specific eating objectives at that moment, to give me a way to rate and rank three different pieces of fruit, but that would have been a bit weird.  OK, a lot weird.  Anway, I was hungry, there just wasn’t time.

Oh, if you’re wondering which fruit I chose, without a scorecard to assist me, I caved and ate the last piece of blueberry pie.  Hey, those blueberries are loaded with antioxidants!


Don’t Ask Me

I didn’t do anything wrong, shady or inappropriate, but my final grade in Calculus II was probably higher than it should have been. In the mid-70s, Calculus II was part of my CEGEP studies at Champlain College on Montreal’s south shore.

After a disastrous mid-term exam, I needed either a big comeback or a small miracle to salvage a decent final grade.  While licking my mid-term exam wounds, I resolved to play less road hockey and maybe even study a little.  Then, right after the mid-term, the mother of all academic miracles arrived in the form of a teachers’ strike.

I played a lot of road hockey during the strike, and occasionally I studied.  The strike was eventually settled during the last week of the semester.  I remember walking nervously back into the last class to see what would happen.  I knew my not so vast knowledge of calculus was likely less vast than it had been at the mid-term, and I was worried that the mid-term results would stand as my grade.

Then, it happened. Our teacher explained that there was no point in giving us a final exam, since we hadn’t covered any new material following the mid-term.  Instead, he asked us to pull out a single sheet of paper, write down what grade we each wanted for the course and explain why we deserved it.

All that fresh air and exercise from playing Canada’s national sport had prepared me well for my Calculus II final exam.  With my brain uncluttered by calculus theory, I was thinking clearly and presented my case.

I explained how in recent years I had tended to start slowly in my math courses, with poor mid-terms always followed by sensational final exams, which was true, even if “sensational” might have overstated the case slightly.  I calculated my average grade in my recent math courses and asked for a grade of 70%, which was slightly lower than my recent average.  My teacher accepted my self-evaluation and I got my 70%.

What lesson can we learn from this? That writing skills are more important than math skills?  That playing road hockey is a great way to prepare for an exam?  Actually, I was thinking more about the wisdom of letting self-interested people grade themselves and how this applies to marketing measurement.

When a company wants to measure its marketing, should we ask the marketers to grade themselves? Perhaps no more than a Calculus II teacher should ask his students to grade themselves.  Although I still feel my logic was sound, I’m pretty sure I was biased in creating my scoring process at the end of the course, for the purpose of justifying the grade I wanted.

Here are a few tips to minimize bias in your marketing measurement:

  • Decide on a measurement process before you do your marketing. Before you do any more marketing, if you don’t have a measurement process, or don’t like the one you have, start by creating a new process.  We all know that a fair employee performance evaluation process involves starting the year with clear goals and having a method for scoring results against those goals so you can fairly award merit increases and bonuses.  Treat marketing measurement the same way so everyone knows marketing’s goals and how the results will be evaluated.
  • Involve key functional areas in creating your measurement process. Since one of marketing’s underlying purposes is to improve the overall performance and health of your company, the measurement process needs input from all key functional areas.  For example, suppose the objective of a specific program is to influence customers to order earlier ahead of your busy period, which will mean you can staff more appropriately, operate more cost effectively and manufacture more efficiently.  Then the departments affected need to be part of creating the measurement process and identifying the right performance metrics and objectives.
  • Ask the marketers, but remember their natural bias. If I just spent $100,000 on a marketing program, and the CEO asks me if it worked, I’m going to try to find a way to prove that I spent the $100,000 very wisely.  I can’t help it.  I’ll want to prove that it worked, as opposed to assess whether it worked. It’s in our human nature to have a positive bias towards our own performance, especially when trying to survive and succeed in a dog eat dog corporate environment.  Still, marketers must play a key role in developing an unbiased measurement process.
  • If you’re the marketer, why not take the lead and ask others. By taking the lead, you can show your willingness to be held accountable, and by creating a process up front, you can avoid much of the bias that comes from creating a measurement process after the fact.  Inviting others in the organization into the process further eliminates bias by making sure that interests other than yours are being taken into consideration.  That will also help keep you out of an awkward conflict of interest position, and any perception that you might be biased.

I caught a break back in CEGEP and basically got to pick my final grade.  It was a bit like going in front of the judge, pleading not guilty, and hearing the judge say, “OK, that’s good enough for me!”.  If as my CEO you want to know how well I’m performing as your VP Marketing, my advice to you is to remember that I have a natural bias towards giving myself a good grade, so don’t ask me!